> This is part 1 of 4 of the full documentation (pages 1–100 of 342).
> The content is paginated: fetch every part to see all of it.
> Next part: https://resources.defirisk.intotheblock.com/llms-full.txt/1
> Page index: https://resources.defirisk.intotheblock.com/llms.txt
# Welcome to the Sentora Risk Radar
[Sentora ](https://sentora.com)is a leading provider of institutional DeFi technology, including infrastructure, yield strategy automations, risk management and more. Our platform serves as the gateway used by some of the largest crypto institutions to access DeFi yields via sophisticated quantitative strategies with corresponding risk management models.
To help streamline institutional adoption of DeFi, Sentora decided to open access to its risk management tools through the [Risk Radar](https://defirisk.sentora.com/).
Risk monitoring and management is paramount for any financial service. The recent events in the DeFi market have proven that risk management is essential to catalyze the growth of the space. Following our experience safeguarding assets in DeFi through advanced risk management models, we believe that expanding these tools and offering them to the public would help make DeFi safer over the mid- to long-term.
A detailed explanation of our Risk Radar goals can be found in [this](https://medium.com/intotheblock/monitoring-economic-risk-in-defi-intotheblock-releases-an-alpha-preview-of-defi-risk-radar-4d650f1e901f) Medium post by our CEO Jesus Rodriguez
# Aave v3
Aave offers a decentralized, non-custodial liquidity platform where individuals have the opportunity to engage either as depositors or borrowers. By contributing liquidity to the market, depositors can earn passive income. Meanwhile, borrowers have the flexibility to obtain loans in a manner that requires over-collateralization.
# Health Factor Distribution
**Overview**
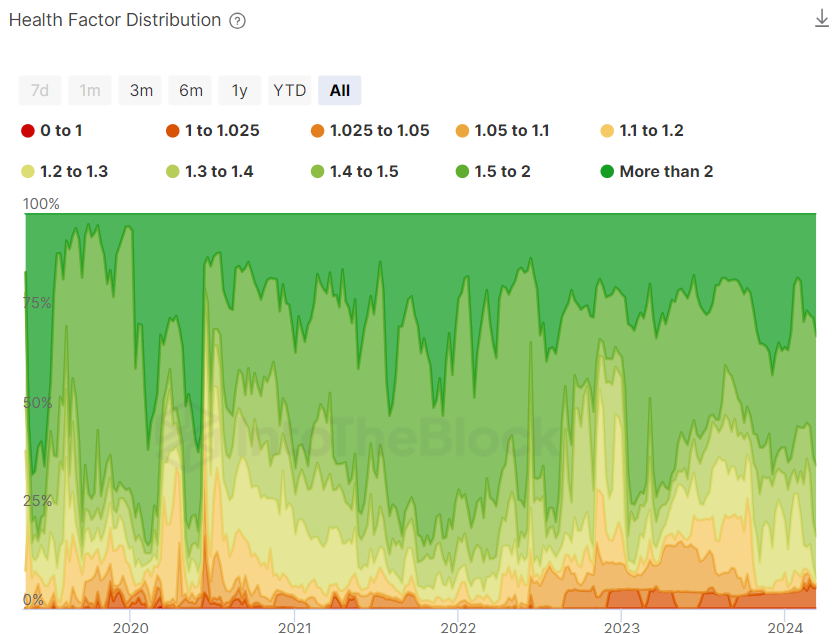
A position's health factor tracks how close to liquidation it is. If the health factor is below 1, it can be liquidated therefore resulting in a loss to the borrower. The Health Factor Distribution indicator shows the share of borrowers within a particular range of health factors, excluding recursive loans.
This indicator is useful to analyze the different range of the protocol’s borrowers, if most of the supply has a low health factor, the solvency of the pool/protocol is at risk due to big liquidations.
**How can I use it?**
This indicator presents useful information both for depositors and liquidators. The greater the amount of loans at risk of liquidation the riskier it becomes for depositors to supply money into the protocol. For liquidators it can be beneficial to analyze during times of market volatility in order to try and anticipate where big liquidations could happen.
Moreover, a more evenly distributed range of health factors indicate that the loans within the protocol are more decentralized across borrowers, making it less likely for all of them to be liquidated at once.
A protocol with a high health factor distribution can be more secure for depositors as there is lower likelihood of massive liquidations, which at times may be unprofitable for liquidators due to slippage on DEXs. Therefore, high health factors should make depositors more comfortable with their positions.
# High Risk Loans
**Overview**
This indicator shows the value of loans that are collateralized against volatile assets that are within 5% of their liquidation threshold. This information is useful to help users understand the protocol and specific pools exposure to high risk loans and for liquidators to anticipate future liquidations
**How can I use it?**
Classifying loans within a 5% liquidation ratio (the ratio of the collateral to the loan value) can provide useful information for understanding the risk associated with a loan in a decentralized finance (DeFi) protocol.
A loan within just 5% of liquidation is considered to be highly risky, as there is a higher likelihood that the loan will be liquidated if the value of the collateral decreases or the loan asset increases in price.
By identifying loans with a liquidation ratio below 5%, investors and users can better understand the level of risk associated, which can help make informed decisions on whether to invest or use the protocol. Additionally, this information can be useful for the DeFi protocol itself to properly manage risk, by adjusting liquidation thresholds or their respective liquidation bonus.
Overall, classifying loans based on their liquidation ratio provides valuable information for understanding the risk associated with each loan and helps ensure the stability and security of the DeFi protocol.
# Liquidation History
**Overview**
This indicator shows the record of all liquidations that have taken place in the Aave protocol over time. Liquidation links are the transaction hash, which can be seen in the Etherscan block explorer. Borrowers are those getting liquidated, while liquidators are seizing their collateral assets.
The indicator is broken down into liquidation, borrower, liquidator, market, debt liquidated collateral seized amount and collateral sized. In addition, it can also be sorted by the liquidation, debt liquidated or collateral seized amount columns.
**How can I use it?**
Knowing the detailed liquidation history in a protocol can provide valuable information for having a clear picture of it. A detailed liquidation history can help users and investors understand the overall risk associated with using the protocol. In addition, it also helps ensure transparency in the protocol, as it provides a clear understanding of the performance of the protocol and the risks associated with using it.
Furthermore, it simplifies the searching process for the most recent liquidations of the protocol, which at times can become tedious.
# Liquidators Leaderboard
**Overview**
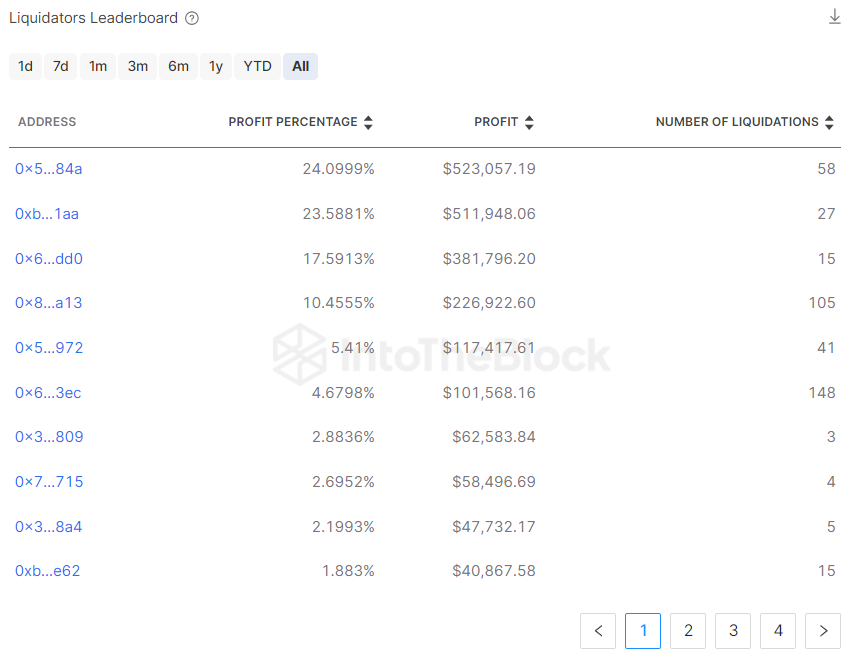
This indicator shows the ranking of the top liquidators based on their profits and number of liquidations.
If the value of the collateral provided for a loan drops below the maximum allowed threshold, it is subject to being liquidated by a liquidator. Liquidators receive a "liquidation bonus", or a percentage of the collateral provided, to incentivize them to rebalance the protocol and avoid debts that cannot be repaid.
This indicator is useful, because it gives an idea of the most involved liquidators with the protocol, the dependencies on each and their overall performance.
**How can I use it?**
Liquidators play a critical role in mitigating risk for DeFi lending protocols. Knowing the top liquidators is helpful as they are often more experienced and knowledgeable about the protocol and the risk involved. In addition, having a sizeable crowd of liquidators engaged with the protocol shows a healthy sign, in the case of any risk events the more liquidators aware the better.
Furthermore, for up and coming liquidators observing and imitating better liquidators in the protocol, one can learn from their experience and make use of their insights and strategies. Experienced liquidators often have established techniques that contribute to their success. Imitating these habits can help up and coming liquidators to develop better practices and improve their performance.
# Liquidations Volume
**Overview**
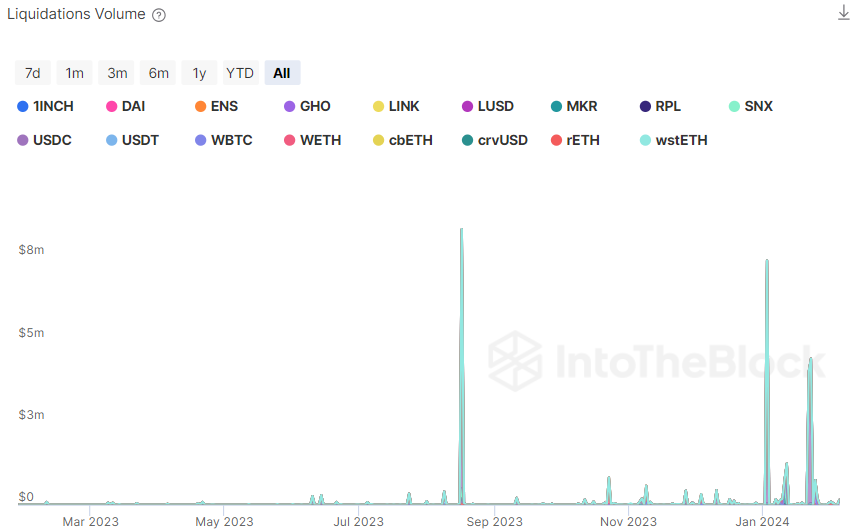
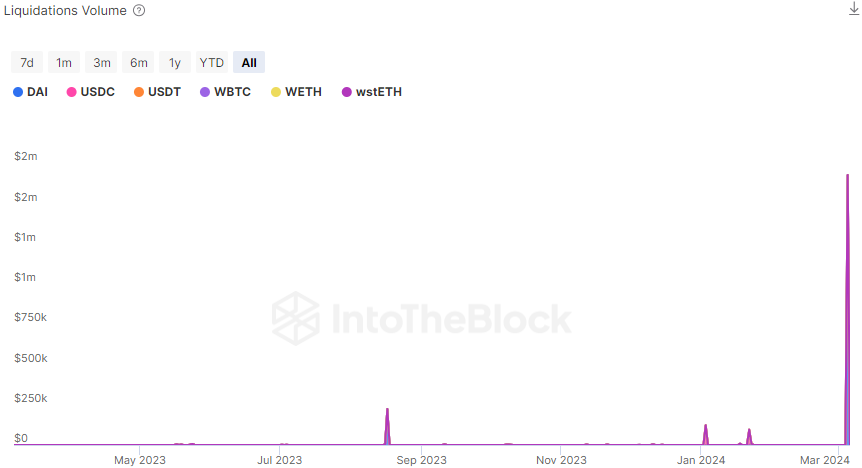
The Liquidation Volume in a DeFi protocol refers to the amount of funds that are seized and sold in the event that a borrower is unable to repay their loan. Liquidations occur when a borrower's collateral falls below a certain value, known as the liquidation threshold.
Here’s an explain it like I’m 5 example of how liquidations take place, where a borrower, Alice, borrows $100 USDC against $140 worth of ETH:
* The value of Alice’s ETH drops to its liquidation threshold, which can be calculated based on its collateral factor.
* Since the USDC borrowed by Alice is someone else’s deposit – let’s say Bob’s USDC – into Aave, the protocol needs to make sure Bob gets his $100 back
* In order to repay the loan, a liquidator, Carl, claims part of Alice’s ETH and slightly less USDC into the protocol, making the difference (known as liquidation bonus)
* This way liquidators like Carl make sure depositors like Bob don’t lose their deposits to borrowers such as Alice taking risky loans
If the value of Alice’s ETH drops such that her position is undercollateralized (i.e. she has less ETH supplied than USDC borrowed) before Carl can liquidate it, then depositors like Bob end up losing part of their funds and the protocol ends with “bad debt”.
**How can I use it?**
The Liquidation Volume in a DeFi protocol provides insight into the level of risk in the system, as higher liquidation volumes can indicate that more borrowers are defaulting on their loans and that the protocol is exposed to greater risk.
In addition, it also provides a sense of the value being obtained by liquidators in order to protect the protocol from bad debt exposure.
# Open Liquidations
**Overview**
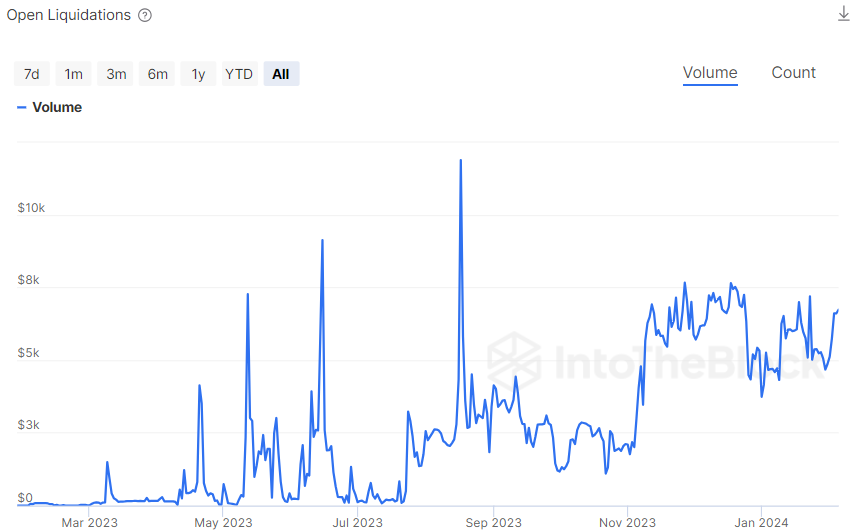
This indicator shows the number of open positions and the corresponding volume pending to be liquidated. This information is useful to gauge the exposure and bad debt that the protocol could face.
**How can I use it?**
Knowing the number of loans that can currently be liquidated on a DeFi protocol can provide useful information for understanding if there are any liquidity issues and the current stability of the protocol.
The number of loans that can currently be liquidated gives an indication of the liquidity in the ecosystem, as it represents that there isn’t any liquidator available to execute the position and gain their corresponding premium. A high number of loans that can be liquidated indicates a high necessity for liquidators, which help ensure that the protocol remains stable and secure.
# Unique Liquidator Addresses
**Overview**
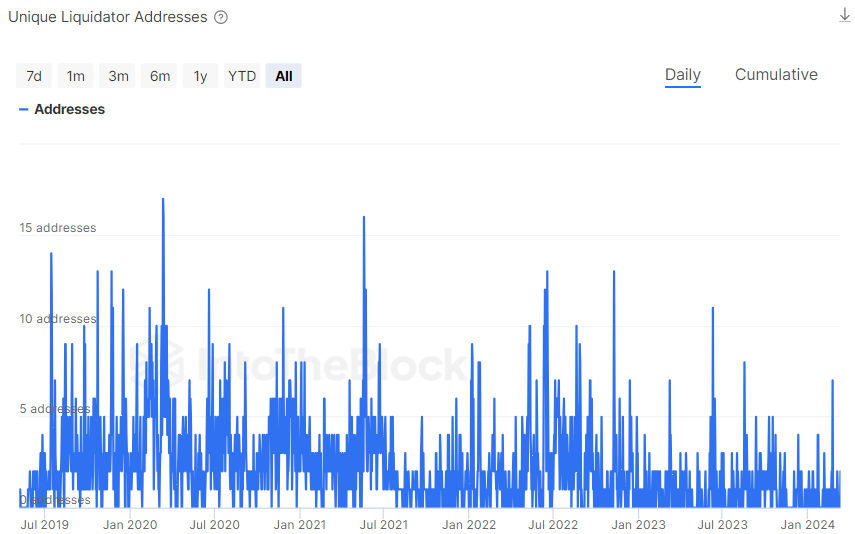
This indicator shows the number of unique addresses that have interacted with liquidation contracts in a given day or cumulatively over time. It is a healthy sign for a protocol to have a high number of addresses reliably liquidating positions, this assures depositors that several different liquidators are monitoring positions in the protocol.
**How can I use it?**
Counting the number of unique liquidators in a decentralized finance (DeFi) protocol can provide useful information for understanding the level of decentralization and security of the protocol.
The more unique liquidators a DeFi protocol has, the more decentralized it is, as the risk of a single party controlling the liquidation process is reduced. This helps ensure that the protocol is not vulnerable to manipulation or exploitation by a single party.
A high number of unique liquidators can provide liquidity to the DeFi protocol, as there are more participants available to liquidate loans if needed. This helps ensure that the protocol remains stable and secure, even during times of high demand.
Furthermore, by tracking the number of unique liquidators, DeFi protocols can better understand the distribution of risk, and take appropriate measures to ensure the stability and security of the protocol.
# Collateral Seized
**Overview**
This indicator shows the total amount of each collateral asset being seized for liquidation. If a borrower has more than one asset as collateral for their loan, liquidators get to choose which asset they will seize in order to repay their debt and keep the protocol safe.
**How can I use it?**
This indicator can present both users and the protocol powerful information. From the protocol stand point the preferred assets among liquidators can provide valuable information about market trends and demand. In general liquidators tend to pick assets that have high liquidity, and thus have In addition, changes in the amount of collateral being seized can provide insight into the health of the protocol and current market conditions, allowing both users and the protocol to make informed decisions.
# Blocks Elapsed to Complete Liquidations
**Overview**
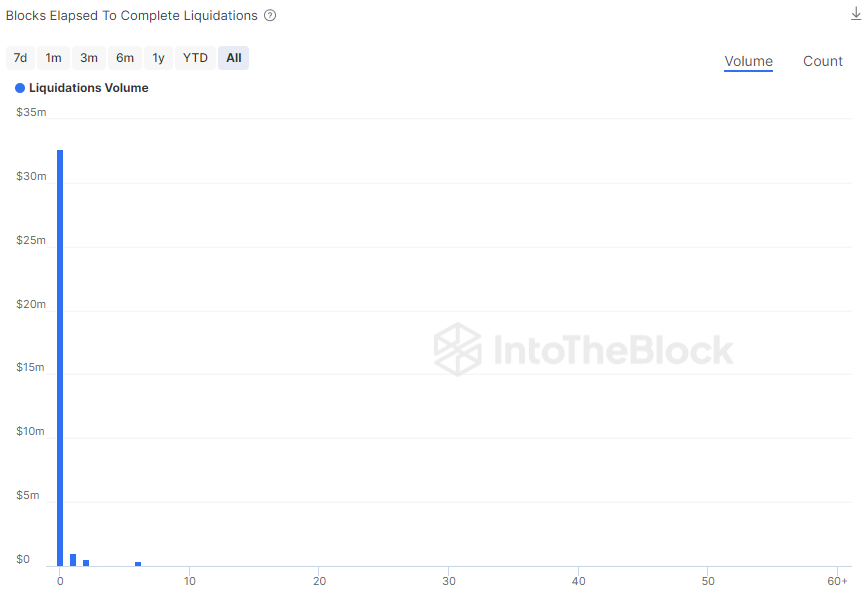
This indicator shows the number of blocks it takes for a liquidation to take place, showing the USD amount and percentage of the liquidation paid per block.
The faster liquidations are done, the lower the risk of insolvency for the protocol as it avoids getting exposure to borrowers’ collateral assets.
**How can I use it?**
This indicator is useful to analyze the level of asset exposure that the protocol incurs when a liquidation opportunity arises. The more blocks the opportunity is open to liquidations, the greater the chances that collateral assets can go down in price and end up not being enough to repay debts.
Furthermore, by analyzing how long a liquidator takes advantage of the opportunity users can gain insight into their reliability. If liquidations are taking longer than a few blocks to be executed it would suggest that these are not profitable for liquidators for reasons such as low liquidity of the underlying asset.
# Net Liquidity Flows
**Overview**
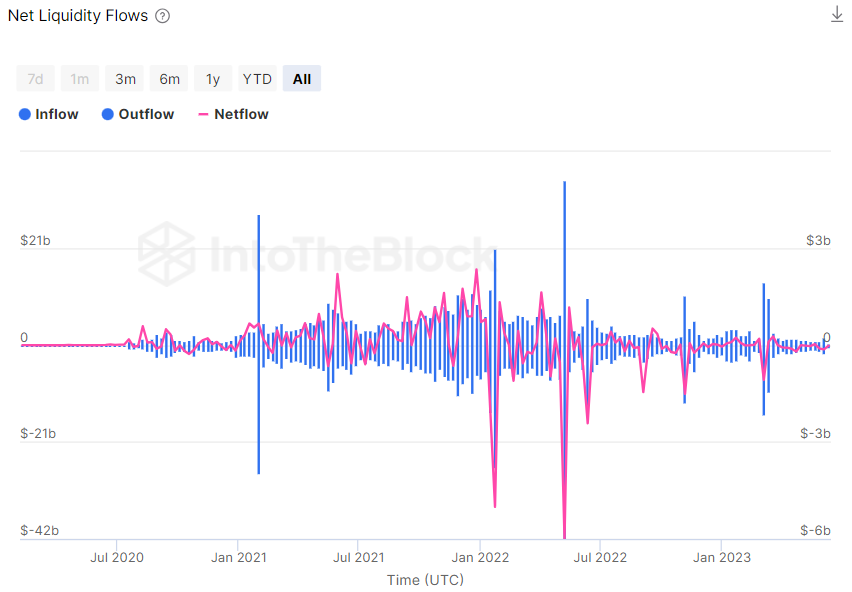
The Net Liquidity Flows metric shows the inflows, outflows and supply netflows (deposits minus withdrawals) of liquidity into the protocol or a specific pool.
**How can I use it?**
Knowing the liquidity flows that come into a protocol can be useful in making decisions.
This can provide insight into the overall health and stability of the protocol. In the case there is a steady flow of liquidity coming into the protocol, it could signal that the protocol is thriving and has a strong borrowing demand. On the other hand, high repayments relative to borrows could signal weakening demand for debt in the protocol.
Overall, knowing the liquidity flows of a protocol can provide valuable information about the health of the protocol.
# Net Loans Flows
**Overview**
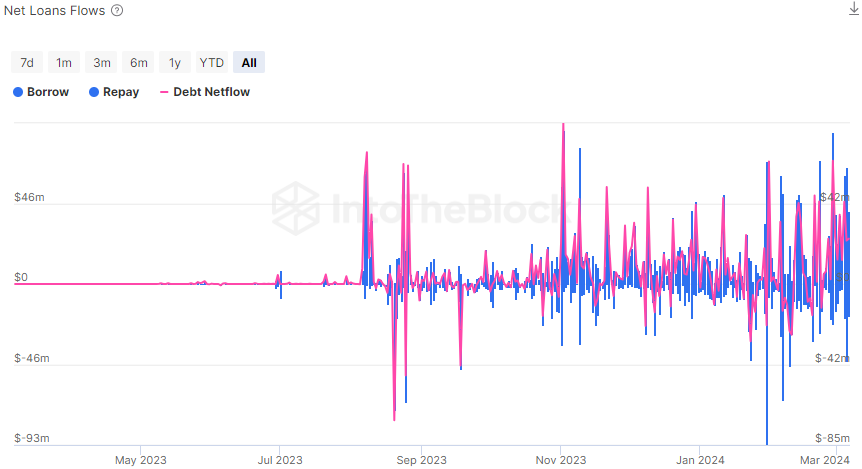
The Net Flows indicator goes over the inflows, outflows and debt netflows (borrows minus repayments) of the borrowing activity in the protocol.
**How can I use it?**
Knowing the inflows, outflows, and netflows of the borrowing activity in a DeFi protocol can provide powerful insight into the borrower's activity. This one can help to assess the liquidity, borrower behavior and market trends. Moreover, by analyzing the inflows and outflows users are able to better understand the liquidity of the DeFi protocol, which is essential to ensuring its stability. In addition, the netflows shown in the indicator give an indication of whether borrowers are taking out loans or repaying them, which helps to gauge their behavior and the health of the protocol.
# Whales Supply History
**Overview**
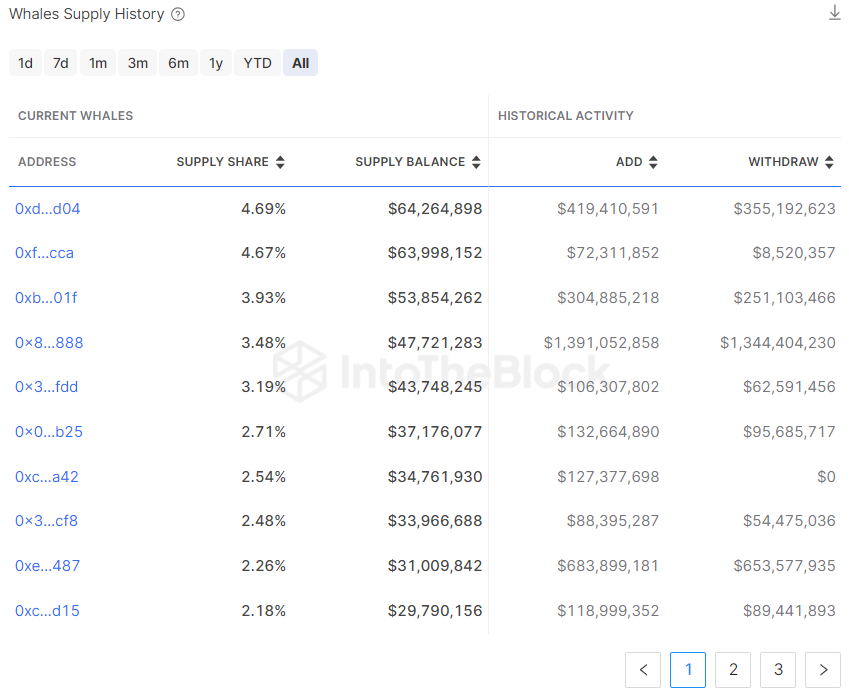
This indicator tracks large depositors' deposits, their total supply share, withdrawal and addition amounts on the protocol. This information gives powerful insight into the largest depositors and backers of the protocol, it also gives an idea of which addresses have the greatest borrowing capacity.
The indicator has an adjustable time frame selector that lets users analyze different periods in the protocol. The supply share column is not affected by the time frame selector, showing the current supply share at all times.
**How can I use it?**
This indicator presents useful information both for borrowers and the protocol. Borrowers can track lenders' supply share and calculate scenarios of liquidity withdrawals and how that might affect interest rates on their loans. Users can also track the largest depositors in order to analyze their borrowing power against their deposits, this can be useful information when investigating lenders leverage over the protocol’s deposits.
# Whales Credit History
**Overview**
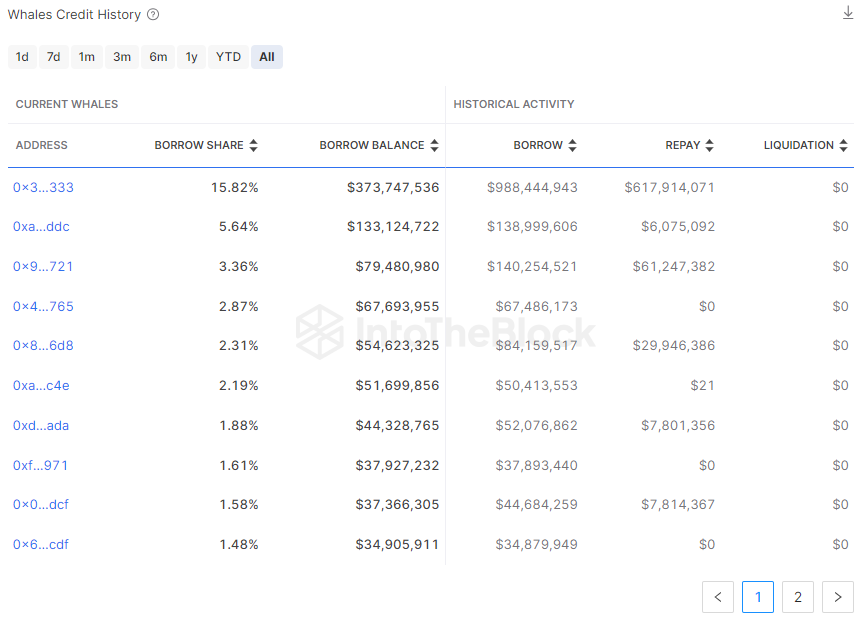
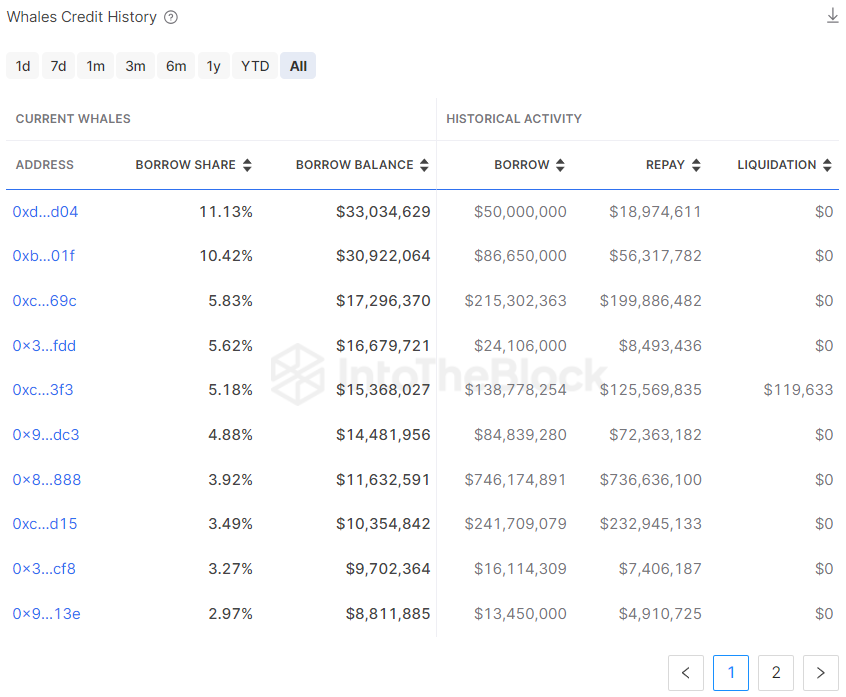
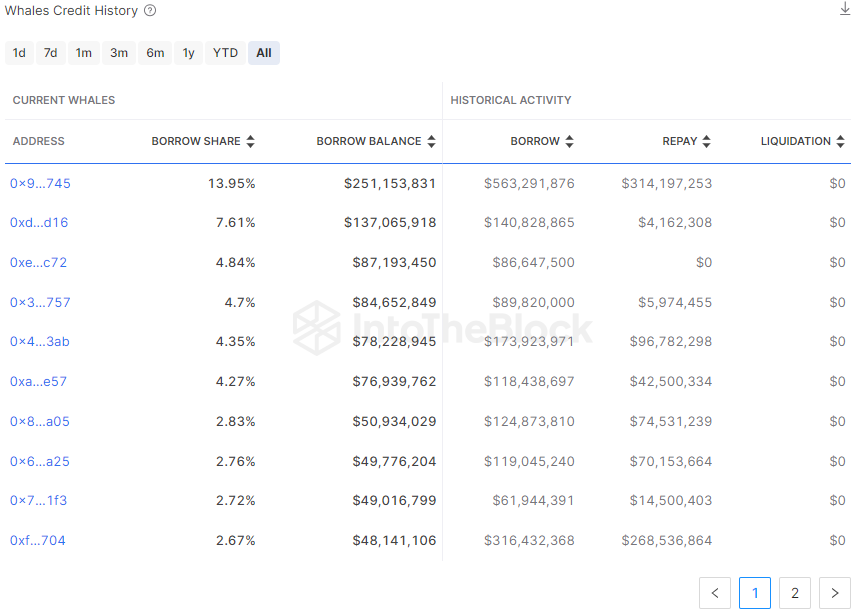
This indicator tracks large depositors' credits, borrowed share, total borrowed, repayments and liquidations history on the protocol. This information helps to have a better understanding of the whales that are currently interacting with the protocol.
For example, if a whale has a track record of being liquidated, it could be likely and probably has a higher chance that it gets liquidated again.
The indicator has an adjustable time frame selector that lets users analyze different periods in the protocol. The supply share column is not affected by the time frame selector, showing the current supply share at all times.
**How can I use it?**
This indicator gives a well rounded picture of the current whale behavior within the protocol. By tracking large depositor behavior, you can gain valuable insight into the activity of the "whales" in the protocol and how they are affecting the ecosystem.
By examining the liquidation history you can assess the risk associated with lending to the protocol. Moreover, by analyzing the recent payments and total debt users can gauge the whale’s previous interactions with the protocol and try to predict their standard behavior.
Furthermore, the current borrow share allows liquidators and lenders to predict scenarios of whales being liquidated.
# Whales Supply Concentration
**Overview**
This indicator shows the historical concentration of supply in the Aave protocol. This is done by separating depositors in the following two categories:
* Whales: addresses with >1% share of deposits
* Investors: addresses with <1% share of deposits
**How can I use it?**
Lending protocols depositors have the risk of having their liquidity trapped on the protocol if all deposits are being lent out at that time.
This information helps users in analyzing the liquidity risk of not being able to withdraw if a whale withdraws their liquidity first.
It’s also important to clarify that most protocols have mechanisms in place to correct these trends with time. In the case utilization rates are driven too high, rates increase act as an incentive for either for more assets being deposited or debt repaid.
# Whale Borrows Concentration
**Overview**
This indicator shows the historical concentration of loans in the Aave protocol. This is done by separating depositors in the following two categories:
* Whales: addresses with >1% share of borrows
* Investors: addresses with <1% share of borrows
**How can I use it?**
Knowing the biggest borrowers of a protocol can help users make more informed decisions as a lender or borrower.
For example, if you are a lender, you may want to carefully evaluate the creditworthiness of the biggest borrowers before deciding whether to lend to them. On the other hand, if you are a borrower, knowing who the biggest borrowers are can help you gauge the level of competition for loan funds and adjust your borrowing strategy accordingly.
Overall, knowing the biggest borrowers from a lending protocol, and their share of all loans, can provide valuable information that can help you make more informed decisions and manage your financial risks more effectively.
# Recursive Lending Health Factor Distribution
**Overview**
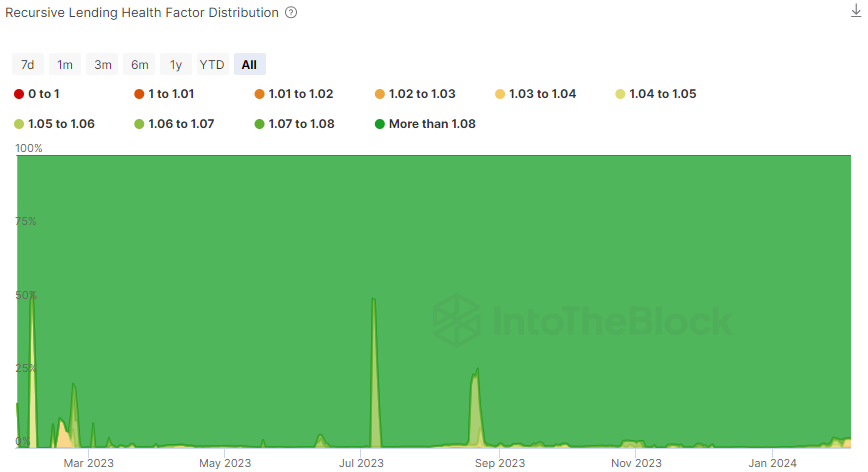
A position's health factor tracks how close to liquidation it is. If the health factor is below 1, it can be liquidated therefore resulting in a loss to the borrower.
The Recursive Lending Health Factor Distribution tracks these values specifically for those rehypothecating their loans, or "looping", back into the protocol. Since this type of loan borrows and deposits the same asset, it can handle a much lower health factor without imminent liquidation risk, which is why there are two separate versions of this indicator.
This indicator is useful to analyze the different range of the protocol’s borrowers, if most of the supply has a low health factor, the solvency of the pool/protocol is at risk due to big liquidations.
**How can I use it?**
As explained with the “Health Factor” documentation, this indicator can provide insights into the liquidity risk of a DeFi lending protocol. It can point out early warnings for both depositors and liquidators which essentially allows users and investors to respond proactively.
For a decentralized finance (DeFi) protocol's recursive lending strategy to be profitable, token incentives must have a higher dollar value than borrowing costs. These incentives are often protocol tokens given as rewards to users, and protocols use this technique in order to attract further deposits/borrows. The sum of the deposit APR and rewards APR needs to be higher than the interest paid on the loan in order for the recursive lending strategy to be profitable.
Since recursive lending strategies use the same asset for these borrow loops, they can handle lower health factors with less risk than loans of one stable asset vs a volatile one. Therefore the thresholds for what is considered a risky recursive loan (shown in red to orange) is much lower than in this case.
# Recursive Lending Supply Share
**Overview**
This indicator goes over the percentage of liquidity provided to the protocol that is made up from recursive lending strategies. Recursive lending strategies are those which borrow an asset which is then resupplied into the lending side and potentially borrowed again, thus rehypothecating the protocol’s debt.
**How can I use it?**
Recursive lending, or looping, has become a popular strategy in DeFi as a way to obtain a higher amount of token incentives on top of a given asset. However, it also involves a degree of risk, as market conditions and changes in interest rates need to be constantly monitored in order to avoid liquidations.
Knowing the percentage of liquidity in a DeFi protocol that is made up from Recursive Lending strategies is useful because it provides insight into the stability and yield generation opportunities of the protocol. A high percentage of liquidity derived from recursive lending strategies can indicate that the DeFi protocol is relying heavily on incentives to attract depositors. This is helpful to gauge how much of the liquidity could be sticky vs simply looking to farm yield short-term.
Furthermore, the percentage of liquidity that recursive lending strategies make can indicate the amount of yield being generated within the DeFi protocol, which can be useful for evaluating investment opportunities.
# Recursive Borrows Share
**Overview**
The Recursive Borrows Share in a DeFi protocol refers to the proportion of the total borrowing activity in the protocol that is generated through recursive lending strategy. Recursive lending strategies are those which borrow an asset which is then resupplied into the lending side and potentially borrowed again, thus rehypothecating the protocol’s debt.
**How can I use it?**
A high proportion of borrowing activity generated through recursive lending can indicate that the protocol is relying heavily on this technique, which can generate second order effects when incentives are no longer aligned for the strategy to be profitable. For example, one can likely expect loans to be repaid if the Recursive Borrows share is 90% and token incentives (or their value) are decreasing.
On the other hand, a low proportion of Recursive Lending Borrows Share can suggest that the DeFi protocol is less reliant on this strategy, which may make it more stable and less susceptible to protocol interest rates and rewards volatility. Understanding this metric can provide valuable insight into the behavior of borrowers and the health of its borrowers.
# Collateral Distribution Behind Borrows
**Overview**
Assets being provided as collateral by borrowers of the given asset. This is important information to depositors of the asset being borrowed since some collateral assets have higher risks than others.
**How can I use it?**
Knowing which type of collateral users deposit into protocols in order to borrow the asset under examination presents useful information in different ways.
Different types of collateral have different levels of risk associated with them. For example, some cryptocurrencies are more volatile than others, and some assets may have more counterparty risk. By understanding the types of collateral being deposited, it can help users and the protocol assess the overall risk of loans against certain type of collaterals.
Understanding which types of collateral are popular can provide insights into risk associated with users. For example, if a large number of users are depositing a volatile asset instead of a stable asset, it may indicate that there is a higher level of risk tolerance among depositors.
In decentralized finance (DeFi) platforms, the types of collateral that are accepted by the protocol are often determined by the community and governance mechanisms. Understanding which types of collateral are being deposited can help users to understand the decision making process and to participate in governance activities.
# Liquidation Profitability Simulation
**Overview**
This indicator simulates according to predetermined variables, how profitable it is for a liquidator to liquidate positions according to their health factor.
**How can I use it?**
The indicator measures on its y-axis how profitable it is in percentage terms to liquidate positions according to their respective health factors shown in the x-axis.
By simulating the profitability of liquidating positions, this indicator can give investors further insight into the well being of the protocol. This can provide valuable insights into the incentives of liquidators to maintain a depositors safe. A higher percentage profitability gives liquidators a greater interest to maintain positions in their supposed parameters.
By considering the potential profitability of liquidating positions, as a risk vector it can help depositors to assess the risk associated with holding onto a position in the protocol. This indicator can inform investors about when the level of profitability is too low for liquidators to maintain a safe environment and keep the protocol away from bad debt.
A low percentage profitability for liquidators can be caused by several factors, some of which include: external liquidity on the blockchain in order to liquidate assets, protocol parameters, borrow caps on assets between others.
# Available Liquidity
**Overview**
In DeFi lending protocols, users can deposit their cryptocurrency assets into a pool from which other users can borrow. The Available Liquidity refers to the amount of funds in these pools that have been deposited but not yet borrowed. It's an essential metric that provides insight into the protocol's current capacity to facilitate new loans.
**How can I use it?**
This indicator serves as a direct measure of the protocol's liquidity. High available liquidity indicates that there is a significant amount of capital ready to be borrowed, which can attract borrowers looking for funds.
In addition it also helps in analyzing, interest rates for borrowers, as this are algorithmically determined based on the supply and demand of funds. High available liquidity tends to lower borrowing rates, making it cheaper for users to take out loans, which can increase borrowing activity and overall protocol usage.
Finally, It helps in assessing the risk of liquidity crises. If the available liquidity is low relative to the market size, it might indicate potential liquidity issues, especially if a large proportion of users decide to withdraw their deposits simultaneously.
# Total Supply
**Overview**
The Total Supply indicator essentially measures the total market size of a DeFi (Decentralized Finance) lending protocol. It comprises both the deposits made into the protocol by lenders and the funds borrowed by borrowers. This metric focuses on the total volume of funds actively engaged in the lending and borrowing process, providing a dynamic view of the protocol's activity.
The indicator encapsulates the entire ecosystem of a lending protocol, including:
* **Deposits:** The total amount of funds that lenders have supplied to the protocol.
* **Borrows:** The total amount of funds that borrowers have currently taken out as loans from the protocol.
The sum of these two components gives us the aggregate market size of the lending protocol, offering a comprehensive snapshot of its financial activity.
**How can I use it?**
This indicator allows users, investors, and analysts to gauge the overall size of the lending protocol's market. A larger aggregate amount suggests a more extensive ecosystem. Moreover, changes in the aggregate amount of funds supplied can be a clear indicator of the protocol's growth or contraction over time. An increasing trend may signal rising trust and participation in the protocol, while a decrease could indicate the opposite.
By comparing this metric across different DeFi lending protocols, stakeholders can evaluate the relative market position and competitiveness of a protocol. This can inform investment decisions, protocol improvements, and strategic planning.
In essence, the aggregate amount of funds supplied for lending is a critical indicator for understanding the scale and dynamics of a DeFi lending protocol. It provides valuable insights into the protocol's market size, growth trends, risk profile, and the liquidity environment, serving as a crucial tool for decision-making and analysis within the DeFi space.
# Total Debt
**Overview**
The Total Debt is a dynamic indicator that fluctuates with borrower activity, including new loans being taken out and existing loans being repaid. It includes:
* **Current Outstanding Loans:** The total value of all active loans that have yet to be repaid.
* **Historical Borrowing Activity:** While primarily concerned with current outstanding amounts, trends in this indicator can also reflect historical borrowing activity and demand patterns over time.
**How can I use it?**
This indicator directly measures the demand for borrowing within the protocol. A high total borrowed amount suggests strong user engagement and a need for the capital offered by the protocol, indicating its relevance and utility in the market.
In addition, the total borrowed amount influences the interest rates in the protocol through supply and demand mechanics. Higher borrowing demand can lead to higher interest rates, which can attract more lenders to the platform, balancing the supply with the demand.
Finally, the borrowing activity within a DeFi lending protocol can provide broader economic insights, such as the prevailing sentiment among crypto investors, trends in leverage use, and the overall health of the crypto market.
# Aave GHO
GHO is stablecoin issued on top of Aave v3 as a collateralized debt position (CDP). Users provide a collateral asset and mint GHO debt against it at a borrowing interest between 1%-1.51%.
The GHO stablecoin has an intended peg of 1-to-1 with the US dollar. Similar to Maker's DAI, it relies on arbitrageurs and a stability module to help preserve its peg. For more info on GHO check out the [GHO documentation](https://docs.gho.xyz/).
# Health Factor Distribution
**Overview**
A position's health factor tracks how close to liquidation it is. If the health factor is below 1, it can be liquidated therefore resulting in a loss to the borrower. The Health Factor Distribution indicator shows the share of borrowers within a particular range of health factors.
This indicator is useful to analyze the different range of the protocol’s borrowers, if most of the supply has a low health factor, the solvency is at risk due to big liquidations.
**How can I use it?**
This indicator presents useful information both for depositors and liquidators. The greater the amount of loans at risk of liquidation the riskier it becomes for depositors to supply money into the protocol. For liquidators it can be beneficial to analyze during times of market volatility in order to try and anticipate where big liquidations could happen.
Moreover, a more evenly distributed range of health factors indicate that the loans within the protocol are more spread-out across borrowers, making it less likely for all of them to be liquidated at once.
A protocol with a high health factor distribution can be more secure for depositors as there is lower likelihood of massive liquidations, which at times may be unprofitable for liquidators due to slippage on DEXs. Therefore, high health factors should make depositors more comfortable with their positions.
# High Risk Loans (USD)
**Overview**
This indicator shows the value of loans that are collateralized against volatile assets that are within 5% of their liquidation threshold. This information is useful to help users understand the protocol and its exposure to high risk loans. Furthermore it helps liquidators to anticipate future liquidations.
**How can I use it?**
Classifying loans within a 5% liquidation ratio (the ratio of the collateral to the loan value) can provide useful information for understanding the risk associated with a loan in a decentralized finance (DeFi) protocol.
A loan within just 5% of liquidation is considered to be highly risky, as there is a higher likelihood that the loan will be liquidated if the value of the collateral decreases or the loan asset increases in price.
By identifying loans with a liquidation ratio below 5%, investors and users can better understand the level of risk associated, which can help make informed decisions on whether to invest or use the protocol. Additionally, this information can be useful for the DeFi protocol itself to properly manage risk, by adjusting liquidation thresholds or their respective liquidation bonus.
Overall, classifying loans based on their liquidation ratio provides valuable information for understanding the risk associated with each loan and helps ensure the stability and security of the DeFi protocol.
# GHO Collateralization Ratio
**Overview**
This indicator monitors the ratio of GHO minted from the AAVE facilitator to Aave's deposits used as collateral backing it. It ensures that GHO is overcollateralized at all times to sustain its intended $1 peg.
The indicator is calculated as the ratio of the number of GHO tokens minted from the AAVE facilitator to the total value of Aave's deposits (in USD) used as collateral backing it.
**How can I use it?**
Monitoring this ratio is essential to maintain the stability and credibility of GHO. If the collateralization falls below a certain level, it could threaten the $1 peg, leading to loss of trust and potential market disruptions. Maintaining overcollateralization is key to ensuring stability and integrity in the associated ecosystem.
The stablecoin industry often requires collateralization to ensure that tokens maintain a stable value. In the case of GHO, keeping track of the overcollateralization ensures that the token continues to sustain its intended $1 peg, making this indicator an essential tool for risk management and operational oversight.
# GHO Supply Flowchart
**Overview**
This indicator provides a historical chart showing the mints (creation) and burns (destruction) of GHO tokens. It serves as a leading indicator to analyze potential supply issues, such as imbalances that can have larger market impacts, including increased slippage or price impact costs when exiting liquidity pools (LPs) or performing swaps.
**How can I use it?**
By tracking the mints and burns of GHO, this indicator helps identify potential supply issues early on. This insight allows traders, liquidity providers, and other stakeholders to take proactive measures to mitigate potential market impacts.
The balance between mints and burns is crucial in managing a token's supply and ensuring stability in the market. Any sudden changes in this balance could lead to unexpected market reactions, making this indicator valuable for those engaged in trading or providing liquidity for GHO. It enhances market awareness and helps in decision-making processes.
# Liquidation History
**Overview**
This indicator shows the record of all liquidations that have taken place for the GHO stablecoin market over time. Liquidation links are the transaction hash, which can be seen in the Etherscan block explorer. Borrowers are those getting liquidated, while liquidators are seizing their collateral assets.
The indicator is broken down into liquidation, borrower, liquidator, market, debt liquidated collateral seized amount and collateral sized. In addition, it can also be sorted by the liquidation, debt liquidated or collateral seized amount columns.
**How can I use it?**
Knowing the detailed liquidation history in a protocol can provide valuable information. A detailed liquidation history can help users and investors understand the overall risk associated with using the protocol. In addition, it also helps ensure transparency in the protocol, as it provides a clear understanding of the performance of the protocol and the risks associated with using it.
Furthermore, it simplifies the searching process for the most recent liquidations of the protocol, which at times can become tedious.
# Liquidations Leaderboard
**Overview**
This indicator shows the ranking of the top liquidators based on their profits and number of liquidations.
If the value of the collateral provided for a loan drops below the maximum allowed threshold, it is subject to being liquidated by a liquidator. Liquidators receive a "liquidation bonus", or a percentage of the collateral provided, to incentivize them to rebalance the protocol and avoid debts that cannot be repaid.
This indicator is useful, because it gives an idea of the most involved liquidators with the protocol, the dependencies on each and their overall performance.
**How can I use it?**
Liquidators play a critical role in mitigating risk for DeFi lending protocols. Knowing the top liquidators is helpful as they are often more experienced and knowledgeable about the protocol and the risk involved. In addition, having a sizable crowd of liquidators engaged with the protocol shows a healthy sign, in the case of any risk events the more liquidators aware the better.
Furthermore, for up and coming liquidators observing and imitating better liquidators in the protocol, can help in learning from their experience and make use of their insights and strategies. Experienced liquidators often have established techniques that contribute to their success. Imitating these habits can help up and coming liquidators to develop better practices and improve their performance.
# Open Liquidations
**Overview**
This indicator shows the number of open positions and the corresponding volume pending to be liquidated. This information is useful to gauge the exposure and bad debt that the protocol could face.
**How can I use it?**
Knowing the number of loans that can currently be liquidated on a DeFi protocol can provide useful information for understanding if there are any liquidity issues and the current stability of the protocol.
The number of loans that can currently be liquidated gives an indication of the liquidity in the ecosystem, as it represents that there isn’t any liquidator available to execute the position and gain their corresponding premium. A high number of loans that can be liquidated indicates a high necessity for liquidators, which help ensure that the protocol remains stable and secure.
# Collateral Distribution Behind Borrows
**Overview**
This indicator evaluates the distribution of collateral assets used to borrow GHO, providing insights into the potential risks associated with bad debt and liquidations. These risks primarily arise from price fluctuations in the collateralized assets. When a wallet has multiple borrows, the collateral shown is directly adapted to the proportion of the user's GHO borrowed, thus offering a detailed view of risk exposure.
The indicator analyzes the types and proportions of assets used as collateral for borrowing GHO. It breaks down the collateral into its different asset classes and presents the information.
**How can I use it?**
By understanding the distribution of collateral assets, stakeholders can assess the potential risks tied to price volatility in those assets. If a substantial portion of collateral consists of highly volatile assets, it may signal an increased risk of liquidation or bad debt. This knowledge enables better risk management and decision-making for borrowers, lenders, and platform involved parties.
Collateralization is a common practice in decentralized finance (DeFi) to secure loans and maintain trust within the system. The choice of collateral and its distribution directly impact the risk profile of borrowing arrangements. Monitoring and analyzing this distribution allow for more strategic borrowing and lending practices, contributing to the overall stability and efficiency of the Aave platform.
# Whales Credit History
**Overview**
This indicator tracks large depositors' credits, borrowed share, total borrowed, repayments and liquidations history on the protocol. This information helps to have a better understanding of the whales that are currently interacting with the protocol.
For example, if a whale has a track record of being liquidated, it could be likely and probably has a higher chance that it gets liquidated again.
The indicator has an adjustable time frame selector that lets users analyze different periods in the protocol. The supply share column is not affected by the time frame selector, showing the current supply share at all times.
**How can I use it?**
This indicator gives a well rounded picture of the current whale behavior within the protocol. By tracking large depositor behavior, you can gain valuable insight into the activity of the "whales" in the protocol and how they are affecting the ecosystem.
By examining the liquidation history you can assess the risk associated with lending to the protocol. Moreover, by analyzing the recent payments and total debt users can gauge the whale’s previous interactions with the protocol and try to predict their standar behavior.
Furthermore, the current borrow share allows liquidators and lenders to predict scenarios of whales being liquidated.
# Average Discount Of AAVE Stakers
**Overview**
This indicator presents a stacked line chart that visualizes the discounts Aave stakers are receiving on the GHO they have minted. By observing the trends and levels of these discounts, it may indicate the "stickiness" or retention of minted GHO within the system.
**How can I use it?**
Analyzing the discounts received by Aave stakers offers valuable insights into user incentives and behavior. If stakers consistently take advantage of discounts to mint GHO, it may signal a high level of retention or "stickiness" for the token within the Aave ecosystem. This could be indicative of strong user engagement, loyalty, or satisfaction
Discounts and incentives often play a crucial role in attracting and retaining users in decentralized finance (DeFi) platforms. Understanding how these incentives are utilized, and the resulting user behavior, can guide further optimization of incentive strategies and contribute to the overall success of a DeFi protocol like Aave. This particular indicator, focusing on GHO minting discounts, is a specific tool to gauge user engagement with this aspect of the platform.
# GHO Peg Performance
**Overview**
This indicator tracks the historical price of GHO in order to monitor the stability of its peg. Observing fluctuations in the price of GHO in relation to its peg allows stakeholders to gauge the stability and effectiveness of the asset's pegging mechanism.
**How can I use it?**
By keeping track of the historical price of GHO in relation to its intended peg, this indicator helps in understanding how well the pegging mechanism is working. Consistent adherence to the peg may reflect robustness and reliability, while significant deviations may signal underlying issues or vulnerabilities. Such insights are valuable for traders, investors and the platform itself in making informed decisions.
Pegged cryptocurrencies or stablecoins are designed to maintain a stable value relative to a specific asset (e.g., fiat currency like the USD) or a basket of assets. Monitoring the stability of such a peg is vital in assessing the asset's reliability and functionality, particularly in a trading or financial context where stability might be a critical factor for users.
# Dex Liquidity
**Overview**
This indicator measures the total liquidity available for trading GHO across three major decentralized exchanges: Curve, Balancer, and Uniswap. By providing insights into the liquidity distribution among these platforms, it assists users in understanding how liquid GHO is and enables them to make informed decisions on where to trade it with the lowest price impact or slippage.
**How can I use it?**
The indicator serves as a valuable tool for traders, liquidity providers, and investors interested in trading GHO. It offers a snapshot of liquidity across different decentralized exchanges, helping users choose the optimal platform for trading. High liquidity often leads to lower slippage and price impact, making the trade more efficient.
# DEX Pool Asset Distribution
**Overview**
This indicator focuses on tracking and analyzing the historical concentration of assets in GHO trading pools on decentralized exchanges (DEXs). By examining the distribution and trends in the composition of these pools, it provides insights into the liquidity, diversity, and potential risks associated with trading GHO on various DEX platforms.
**How can I use it?**
The historical concentration of assets in GHO trading pools reflects the pool's liquidity, stability, and attractiveness for traders. A diverse and balanced asset distribution might signify lower risks and better trading opportunities, while significant concentrations could indicate potential vulnerabilities. Traders, liquidity providers, and platform operators can leverage this information to make strategic decisions, manage risks, and optimize trading experiences.
Decentralized trading pools play a crucial role in DeFi, facilitating peer-to-peer trades without intermediaries. Understanding the asset distribution within these pools is key to assessing their functionality, attractiveness, and potential risks. This indicator, focused on GHO trading pools, offers valuable insights into the historical evolution and composition of these pools, supporting informed trading and investment decisions.
# DEX Exit Fee Simulation
**Overview**
This indicator uses simulations to project the potential slippage for GHO depositors if whale addresses (large depositors) were to withdraw their liquidity. By modeling the possible outcomes of significant liquidity withdrawals by the largest depositors, it provides insights into the potential market impacts, risks, and slippage conditions.
The indicator leverages historical data, current market conditions, and specific modeling techniques to simulate scenarios where large depositors withdraw their GHO liquidity. Various factors, such as the size of the withdrawal, current liquidity pool composition, trading volumes, and market dynamics, are considered in the simulations.
**How can I use it?**
Understanding the potential slippage if large depositors withdraw can help traders, investors, and liquidity providers gauge the risks and market stability associated with GHO. By projecting these scenarios, market participants can make informed decisions, set proper risk management strategies, and anticipate possible market movements.
In decentralized finance, slippage refers to the difference between the expected price of a trade and the actual price at which it's executed. Significant withdrawals from large holders (whales) can cause substantial price shifts and slippage, affecting other traders and market dynamics. This indicator, focusing on GHO, helps in understanding and preparing for potential large-scale withdrawal scenarios, thereby aiding in risk management and strategic planning.
# DEX Pool Concentration
**Overview**
This indicator quantifies the percentage of liquidity provided by the largest addresses (whales) into GHO liquidity pools. By assessing the proportion of liquidity stemming from these major holders, it offers essential insights into the dependence of a pool on whales to provide liquidity depth.
The indicator calculates the total amount of liquidity contributed by the identified whale addresses in GHO pools. It then divides this amount by the total liquidity in the pools to derive the percentage of liquidity provided by these large addresses.
**How can I use it?**
Knowing the extent to which a liquidity pool relies on whales can help market participants, including traders, investors, and liquidity providers, understand the potential risks and stability of the pool. High reliance on whales might signal vulnerability to sudden liquidity withdrawals or changes in the behavior of large holders, possibly leading to increased slippage and price volatility.
# Facilitator GHO Supply Flowchart - Aave V3 Ethereum Pool
**Overview**
This indicator features a historical chart showcasing the mints and burns of GHO carried out by each facilitator within the Aave V3 Ethereum Pool. The chart includes daily mint and burn flows, along with an additional line representing the total netflows.
The indicator is divided into three main components:
Daily Mints & Burns: Tracks the daily quantity of GHO tokens minted and burned by each facilitator.
Netflows: Calculates the cumulative amount of GHO supplied by the facilitator over time, including both mints and burns.
Facilitator Health: It also helps in evaluating the ratio of mints to burns, alerting to potential insolvency risks if large burns are detected.
**How can I use it?**
Daily tracking ensures a granular view of facilitator activity, allowing for timely identification of trends or anomalies.
By monitoring the GHO supply activity of facilitators, the indicator provides valuable insights into the health and stability of facilitators. A sudden increase in burns, for example, could signal financial distress, potential insolvency risks, or other operational issues.
Facilitators play a vital role in managing liquidity within decentralized finance (DeFi) ecosystems. Their activity in minting and burning tokens can impact the stability and trustworthiness of specific assets or pools. Analyzing this activity provides critical insights into the facilitator's operational integrity and the broader market dynamics of GHO.
# Facilitator GHO Supply Flowchart - FlashMinter Facilitator
**Overview**
This indicator encapsulates a historical chart portraying mints and burns of GHO tokens conducted by the FlashMinter Facilitator. It includes daily mint and burn flows as well as the total netflows of the GHO supplied by the facilitator.
**How can I use it?**
This indicator serves as a critical gauge of the FlashMinter Facilitator's health, reflecting the behavior of minting and burning GHO tokens. Abnormalities in the pattern, especially large burns, could warn of possible insolvency risks or other challenges within the facilitator's operations.
In the DeFi landscape, facilitators are often responsible for managing liquidity and ensuring the stability of specific assets or pools. Monitoring their activity in minting and burning tokens like GHO is vital to understand their performance, operational stability, and the potential risks associated with their actions.
# Compound v2
Compound V2 is a decentralized finance (DeFi) protocol that enables users to lend or borrow cryptocurrencies in a trustless ecosystem. By depositing assets into the protocol, lenders can earn interest, while borrowers can secure loans by providing collateral, all managed through smart contracts.
# Health Factor Distribution
**Overview**
A position's health factor tracks how close to liquidation it is. If the health factor is below 1, it can be liquidated therefore resulting in a loss to the borrower. The Health Factor Distribution indicator shows the share of borrowers within a particular range of health factors, excluding recursive loans.
This indicator is useful to analyze the different range of the protocol’s borrowers, if most of the supply has a low health factor, the solvency of the pool/protocol is at risk due to big liquidations.
**How can I use it?**
This indicator presents useful information both for depositors and liquidators. The greater the amount of loans at risk of liquidation the riskier it becomes for depositors to supply money into the protocol. For liquidators it can be beneficial to analyze during times of market volatility in order to try and anticipate where big liquidations could happen.
Moreover, a more evenly distributed range of health factors indicate that the loans within the protocol are more decentralized across borrowers, making it less likely for all of them to be liquidated at once.
A protocol with a high health factor distribution can be more secure for depositors as there is lower likelihood of massive liquidations, which at times may be unprofitable for liquidators due to slippage on DEXs. Therefore, high health factors should make depositors more comfortable with their positions.
# High Risk Loans
**Overview**
This indicator shows the value of loans that are collateralized against volatile assets that are within 5% of their liquidation threshold. This information is useful to help users understand the protocol and specific pools exposure to high risk loans and for liquidators to anticipate future liquidations
**How can I use it?**
Classifying loans within a 5% liquidation ratio (the ratio of the collateral to the loan value) can provide useful information for understanding the risk associated with a loan in a decentralized finance (DeFi) protocol.
A loan within just 5% of liquidation is considered to be highly risky, as there is a higher likelihood that the loan will be liquidated if the value of the collateral decreases or the loan asset increases in price.
By identifying loans with a liquidation ratio below 5%, investors and users can better understand the level of risk associated, which can help make informed decisions on whether to invest or use the protocol. Additionally, this information can be useful for the DeFi protocol itself to properly manage risk, by adjusting liquidation thresholds or their respective liquidation bonus.
Overall, classifying loans based on their liquidation ratio provides valuable information for understanding the risk associated with each loan and helps ensure the stability and security of the DeFi protocol.
# Liquidation History
**Overview**
This indicator shows the record of all liquidations that have taken place in the Compound v2 protocol over time. Liquidation links are the transaction hash, which can be seen in the Etherscan block explorer. Borrowers are those getting liquidated, while liquidators are seizing their collateral assets.
The indicator is broken down into liquidation, borrower, liquidator, market, debt liquidated collateral seized amount and collateral sized. In addition, it can also be sorted by the liquidation, debt liquidated or collateral seized amount columns.
**How can I use it?**
Knowing the detailed liquidation history in a protocol can provide valuable information for having a clear picture of it. A detailed liquidation history can help users and investors understand the overall risk associated with using the protocol. In addition, it also helps ensure transparency in the protocol, as it provides a clear understanding of the performance of the protocol and the risks associated with using it.
Furthermore, it simplifies the searching process for the most recent liquidations of the protocol, which at times can become tedious.
# Liquidators Leaderboard
**Overview**
This indicator shows the ranking of the top liquidators based on their profits and number of liquidations.
If the value of the collateral provided for a loan drops below the maximum allowed threshold, it is subject to being liquidated by a liquidator. Liquidators receive a "liquidation bonus", or a percentage of the collateral provided, to incentivize them to rebalance the protocol and avoid debts that cannot be repaid.
This indicator is useful, because it gives an idea of the most involved liquidators with the protocol, the dependencies on each and their overall performance.
**How can I use it?**
Liquidators play a critical role in mitigating risk for DeFi lending protocols. Knowing the top liquidators is helpful as they are often more experienced and knowledgeable about the protocol and the risk involved. In addition, having a sizeable crowd of liquidators engaged with the protocol shows a healthy sign, in the case of any risk events the more liquidators aware the better.
Furthermore, for up and coming liquidators observing and imitating better liquidators in the protocol, one can learn from their experience and make use of their insights and strategies. Experienced liquidators often have established techniques that contribute to their success. Imitating these habits can help up and coming liquidators to develop better practices and improve their performance.
# Liquidations Volume
**Overview**
The Liquidation Volume in a DeFi protocol refers to the amount of funds that are seized and sold in the event that a borrower is unable to repay their loan. Liquidations occur when a borrower's collateral falls below a certain value, known as the liquidation threshold.
Here’s an explain it like I’m 5 example of how liquidations take place, where a borrower, Alice, borrows $100 USDC against $140 worth of ETH:
* The value of Alice’s ETH drops to its liquidation threshold, which can be calculated based on its collateral factor.
* Since the USDC borrowed by Alice is someone else’s deposit – let’s say Bob’s USDC – into Compound v2, the protocol needs to make sure Bob gets his $100 back
* In order to repay the loan, a liquidator, Carl, claims part of Alice’s ETH and slightly less USDC into the protocol, making the difference (known as liquidation bonus)
* This way liquidators like Carl make sure depositors like Bob don’t lose their deposits to borrowers such as Alice taking risky loans
If the value of Alice’s ETH drops such that her position is undercollateralized (i.e. she has less ETH supplied than USDC borrowed) before Carl can liquidate it, then depositors like Bob end up losing part of their funds and the protocol ends with “bad debt”.
**How can I use it?**
The Liquidation Volume in a DeFi protocol provides insight into the level of risk in the system, as higher liquidation volumes can indicate that more borrowers are defaulting on their loans and that the protocol is exposed to greater risk.
In addition, it also provides a sense of the value being obtained by liquidators in order to protect the protocol from bad debt exposure.
# Open Liquidations
**Overview**
This indicator shows the number of open positions and the corresponding volume pending to be liquidated. This information is useful to gauge the exposure and bad debt that the protocol could face.
**How can I use it?**
Knowing the number of loans that can currently be liquidated on a DeFi protocol can provide useful information for understanding if there are any liquidity issues and the current stability of the protocol.
The number of loans that can currently be liquidated gives an indication of the liquidity in the ecosystem, as it represents that there isn’t any liquidator available to execute the position and gain their corresponding premium. A high number of loans that can be liquidated indicates a high necessity for liquidators, which help ensure that the protocol remains stable and secure.
# Unique Liquidator Addresses
**Overview**
This indicator shows the number of unique addresses that have interacted with liquidation contracts in a given day or cumulatively over time. It is a healthy sign for a protocol to have a high number of addresses reliably liquidating positions, this assures depositors that several different liquidators are monitoring positions in the protocol.
**How can I use it?**
Counting the number of unique liquidators in a decentralized finance (DeFi) protocol can provide useful information for understanding the level of decentralization and security of the protocol.
The more unique liquidators a DeFi protocol has, the more decentralized it is, as the risk of a single party controlling the liquidation process is reduced. This helps ensure that the protocol is not vulnerable to manipulation or exploitation by a single party.
A high number of unique liquidators can provide liquidity to the DeFi protocol, as there are more participants available to liquidate loans if needed. This helps ensure that the protocol remains stable and secure, even during times of high demand.
Furthermore, by tracking the number of unique liquidators, DeFi protocols can better understand the distribution of risk, and take appropriate measures to ensure the stability and security of the protocol.
# Collateral Seized
**Overview**
This indicator shows the total amount of each collateral asset being seized for liquidation. If a borrower has more than one asset as collateral for their loan, liquidators get to choose which asset they will seize in order to repay their debt and keep the protocol safe.
**How can I use it?**
This indicator can present both users and the protocol powerful information. From the protocol stand point the preferred assets among liquidators can provide valuable information about market trends and demand. In general liquidators tend to pick assets that have high liquidity, and thus have In addition, changes in the amount of collateral being seized can provide insight into the health of the protocol and current market conditions, allowing both users and the protocol to make informed decisions.
# Blocks Elapsed to Complete Liquidations
**Overview**
This indicator shows the number of blocks it takes for a liquidation to take place, showing the USD amount and percentage of the liquidation paid per block.
The faster liquidations are done, the lower the risk of insolvency for the protocol as it avoids getting exposure to borrowers’ collateral assets.
**How can I use it?**
This indicator is useful to analyze the level of asset exposure that the protocol incurs when a liquidation opportunity arises. The more blocks the opportunity is open to liquidations, the greater the chances that collateral assets can go down in price and end up not being enough to repay debts.
Furthermore, by analyzing how long a liquidator takes advantage of the opportunity users can gain insight into their reliability. If liquidations are taking longer than a few blocks to be executed it would suggest that these are not profitable for liquidators for reasons such as low liquidity of the underlying asset.
# Net Liquidity Flows
**Overview**
The Net Liquidity Flows metric shows the inflows, outflows and supply netflows (deposits minus withdrawals) of liquidity into the protocol or a specific pool.
**How can I use it?**
Knowing the liquidity flows that come into a protocol can be useful in making decisions.
This can provide insight into the overall health and stability of the protocol. In the case there is a steady flow of liquidity coming into the protocol, it could signal that the protocol is thriving and has a strong borrowing demand. On the other hand, high repayments relative to borrows could signal weakening demand for debt in the protocol.
Overall, knowing the liquidity flows of a protocol can provide valuable information about the health of the protocol.
# Net Loans Flows
**Overview**
The Net Flows indicator goes over the inflows, outflows and debt netflows (borrows minus repayments) of the borrowing activity in the protocol.
**How can I use it?**
Knowing the inflows, outflows, and netflows of the borrowing activity in a DeFi protocol can provide powerful insight into the borrower's activity. This one can help to assess the liquidity, borrower behavior and market trends. Moreover, by analyzing the inflows and outflows users are able to better understand the liquidity of the DeFi protocol, which is essential to ensuring its stability. In addition, the netflows shown in the indicator give an indication of whether borrowers are taking out loans or repaying them, which helps to gauge their behavior and the health of the protocol.
# Whales Supply History
**Overview**
This indicator tracks large depositors' deposits, their total supply share, withdrawal and addition amounts on the protocol. This information gives powerful insight into the largest depositors and backers of the protocol, it also gives an idea of which addresses have the greatest borrowing capacity.
The indicator has an adjustable time frame selector that lets users analyze different periods in the protocol. The supply share column is not affected by the time frame selector, showing the current supply share at all times.
**How can I use it?**
This indicator presents useful information both for borrowers and the protocol. Borrowers can track lenders' supply share and calculate scenarios of liquidity withdrawals and how that might affect interest rates on their loans. Users can also track the largest depositors in order to analyze their borrowing power against their deposits, this can be useful information when investigating lenders leverage over the protocol’s deposits.
# Whales Credit History
**Overview**
This indicator tracks large depositors' credits, borrowed share, total borrowed, repayments and liquidations history on the protocol. This information helps to have a better understanding of the whales that are currently interacting with the protocol.
For example, if a whale has a track record of being liquidated, it could be likely and probably has a higher chance that it gets liquidated again.
The indicator has an adjustable time frame selector that lets users analyze different periods in the protocol. The supply share column is not affected by the time frame selector, showing the current supply share at all times.
**How can I use it?**
This indicator gives a well rounded picture of the current whale behavior within the protocol. By tracking large depositor behavior, you can gain valuable insight into the activity of the "whales" in the protocol and how they are affecting the ecosystem.
By examining the liquidation history you can assess the risk associated with lending to the protocol. Moreover, by analyzing the recent payments and total debt users can gauge the whale’s previous interactions with the protocol and try to predict their standard behavior.
Furthermore, the current borrow share allows liquidators and lenders to predict scenarios of whales being liquidated.
# Whales Supply Concentration
**Overview**
This indicator shows the historical concentration of supply in the Compound v2 protocol. This is done by separating depositors in the following two categories:
* Whales: addresses with >1% share of deposits
* Investors: addresses with <1% share of deposits
**How can I use it?**
Lending protocols depositors have the risk of having their liquidity trapped on the protocol if all deposits are being lent out at that time.
This information helps users in analyzing the liquidity risk of not being able to withdraw if a whale withdraws their liquidity first.
It’s also important to clarify that most protocols have mechanisms in place to correct these trends with time. In the case utilization rates are driven too high, rates increase act as an incentive for either for more assets being deposited or debt repaid.
# Whale Borrows Concentration
**Overview**
This indicator shows the historical concentration of loans in the Compound v2 protocol. This is done by separating depositors in the following two categories:
* Whales: addresses with >1% share of borrows
* Investors: addresses with <1% share of borrows
**How can I use it?**
Knowing the biggest borrowers of a protocol can help users make more informed decisions as a lender or borrower.
For example, if you are a lender, you may want to carefully evaluate the creditworthiness of the biggest borrowers before deciding whether to lend to them. On the other hand, if you are a borrower, knowing who the biggest borrowers are can help you gauge the level of competition for loan funds and adjust your borrowing strategy accordingly.
Overall, knowing the biggest borrowers from a lending protocol, and their share of all loans, can provide valuable information that can help you make more informed decisions and manage your financial risks more effectively.
# Recursive Lending Health Factor Distribution
**Overview**
A position's health factor tracks how close to liquidation it is. If the health factor is below 1, it can be liquidated therefore resulting in a loss to the borrower.
The Recursive Lending Health Factor Distribution tracks these values specifically for those rehypothecating their loans, or "looping", back into the protocol. Since this type of loan borrows and deposits the same asset, it can handle a much lower health factor without imminent liquidation risk, which is why there are two separate versions of this indicator.
This indicator is useful to analyze the different range of the protocol’s borrowers, if most of the supply has a low health factor, the solvency of the pool/protocol is at risk due to big liquidations.
**How can I use it?**
As explained with the “Health Factor” documentation, this indicator can provide insights into the liquidity risk of a DeFi lending protocol. It can point out early warnings for both depositors and liquidators which essentially allows users and investors to respond proactively.
For a decentralized finance (DeFi) protocol's recursive lending strategy to be profitable, token incentives must have a higher dollar value than borrowing costs. These incentives are often protocol tokens given as rewards to users, and protocols use this technique in order to attract further deposits/borrows. The sum of the deposit APR and rewards APR needs to be higher than the interest paid on the loan in order for the recursive lending strategy to be profitable.
Since recursive lending strategies use the same asset for these borrow loops, they can handle lower health factors with less risk than loans of one stable asset vs a volatile one. Therefore the thresholds for what is considered a risky recursive loan (shown in red to orange) is much lower than in this case.
# Recursive Lending Supply Share
**Overview**
This indicator goes over the percentage of liquidity provided to the protocol that is made up from recursive lending strategies. Recursive lending strategies are those which borrow an asset which is then resupplied into the lending side and potentially borrowed again, thus rehypothecating the protocol’s debt.
**How can I use it?**
Recursive lending, or looping, has become a popular strategy in DeFi as a way to obtain a higher amount of token incentives on top of a given asset. However, it also involves a degree of risk, as market conditions and changes in interest rates need to be constantly monitored in order to avoid liquidations.
Knowing the percentage of liquidity in a DeFi protocol that is made up from Recursive Lending strategies is useful because it provides insight into the stability and yield generation opportunities of the protocol. A high percentage of liquidity derived from recursive lending strategies can indicate that the DeFi protocol is relying heavily on incentives to attract depositors. This is helpful to gauge how much of the liquidity could be sticky vs simply looking to farm yield short-term.
Furthermore, the percentage of liquidity that recursive lending strategies make can indicate the amount of yield being generated within the DeFi protocol, which can be useful for evaluating investment opportunities.
# Recursive Borrows Share
**Overview**
The Recursive Borrows Share in a DeFi protocol refers to the proportion of the total borrowing activity in the protocol that is generated through recursive lending strategy. Recursive lending strategies are those which borrow an asset which is then resupplied into the lending side and potentially borrowed again, thus rehypothecating the protocol’s debt.
**How can I use it?**
A high proportion of borrowing activity generated through recursive lending can indicate that the protocol is relying heavily on this technique, which can generate second order effects when incentives are no longer aligned for the strategy to be profitable. For example, one can likely expect loans to be repaid if the Recursive Borrows share is 90% and token incentives (or their value) are decreasing.
On the other hand, a low proportion of Recursive Lending Borrows Share can suggest that the DeFi protocol is less reliant on this strategy, which may make it more stable and less susceptible to protocol interest rates and rewards volatility. Understanding this metric can provide valuable insight into the behavior of borrowers and the health of its borrowers.
# Collateral Distribution Behind Borrows
**Overview**
Assets being provided as collateral by borrowers of the given asset. This is important information to depositors of the asset being borrowed since some collateral assets have higher risks than others.
**How can I use it?**
Knowing which type of collateral users deposit into protocols in order to borrow the asset under examination presents useful information in different ways.
Different types of collateral have different levels of risk associated with them. For example, some cryptocurrencies are more volatile than others, and some assets may have more counterparty risk. By understanding the types of collateral being deposited, it can help users and the protocol assess the overall risk of loans against certain type of collaterals.
Understanding which types of collateral are popular can provide insights into risk associated with users. For example, if a large number of users are depositing a volatile asset instead of a stable asset, it may indicate that there is a higher level of risk tolerance among depositors.
In decentralized finance (DeFi) platforms, the types of collateral that are accepted by the protocol are often determined by the community and governance mechanisms. Understanding which types of collateral are being deposited can help users to understand the decision making process and to participate in governance activities.
# Liquidation Profitability Simulation
**Overview**
This indicator simulates according to predetermined variables, how profitable it is for a liquidator to liquidate positions according to their health factor.
**How can I use it?**
The indicator measures on its y-axis how profitable it is in percentage terms to liquidate positions according to their respective health factors shown in the x-axis.
By simulating the profitability of liquidating positions, this indicator can give investors further insight into the well being of the protocol. This can provide valuable insights into the incentives of liquidators to maintain a depositors safe. A higher percentage profitability gives liquidators a greater interest to maintain positions in their supposed parameters.
By considering the potential profitability of liquidating positions, as a risk vector it can help depositors to assess the risk associated with holding onto a position in the protocol. This indicator can inform investors about when the level of profitability is too low for liquidators to maintain a safe environment and keep the protocol away from bad debt.
A low percentage profitability for liquidators can be caused by several factors, some of which include: external liquidity on the blockchain in order to liquidate assets, protocol parameters, borrow caps on assets between others.
# Available Liquidity
**Overview**
In DeFi lending protocols, users can deposit their cryptocurrency assets into a pool from which other users can borrow. The Available Liquidity refers to the amount of funds in these pools that have been deposited but not yet borrowed. It's an essential metric that provides insight into the protocol's current capacity to facilitate new loans.
**How can I use it?**
This indicator serves as a direct measure of the protocol's liquidity. High available liquidity indicates that there is a significant amount of capital ready to be borrowed, which can attract borrowers looking for funds.
In addition it also helps in analyzing, interest rates for borrowers, as this are algorithmically determined based on the supply and demand of funds. High available liquidity tends to lower borrowing rates, making it cheaper for users to take out loans, which can increase borrowing activity and overall protocol usage.
Finally, It helps in assessing the risk of liquidity crises. If the available liquidity is low relative to the market size, it might indicate potential liquidity issues, especially if a large proportion of users decide to withdraw their deposits simultaneously.
# Total Supply
**Overview**
The Total Supply indicator essentially measures the total market size of a DeFi (Decentralized Finance) lending protocol. It comprises both the deposits made into the protocol by lenders and the funds borrowed by borrowers. This metric focuses on the total volume of funds actively engaged in the lending and borrowing process, providing a dynamic view of the protocol's activity.
The indicator encapsulates the entire ecosystem of a lending protocol, including:
* **Deposits:** The total amount of funds that lenders have supplied to the protocol.
* **Borrows:** The total amount of funds that borrowers have currently taken out as loans from the protocol.
The sum of these two components gives us the aggregate market size of the lending protocol, offering a comprehensive snapshot of its financial activity.
**How can I use it?**
This indicator allows users, investors, and analysts to gauge the overall size of the lending protocol's market. A larger aggregate amount suggests a more extensive ecosystem. Moreover, changes in the aggregate amount of funds supplied can be a clear indicator of the protocol's growth or contraction over time. An increasing trend may signal rising trust and participation in the protocol, while a decrease could indicate the opposite.
By comparing this metric across different DeFi lending protocols, stakeholders can evaluate the relative market position and competitiveness of a protocol. This can inform investment decisions, protocol improvements, and strategic planning.
In essence, the aggregate amount of funds supplied for lending is a critical indicator for understanding the scale and dynamics of a DeFi lending protocol. It provides valuable insights into the protocol's market size, growth trends, risk profile, and the liquidity environment, serving as a crucial tool for decision-making and analysis within the DeFi space.
# Total Debt
**Overview**
The Total Debt is a dynamic indicator that fluctuates with borrower activity, including new loans being taken out and existing loans being repaid. It includes:
* **Current Outstanding Loans:** The total value of all active loans that have yet to be repaid.
* **Historical Borrowing Activity:** While primarily concerned with current outstanding amounts, trends in this indicator can also reflect historical borrowing activity and demand patterns over time.
**How can I use it?**
This indicator directly measures the demand for borrowing within the protocol. A high total borrowed amount suggests strong user engagement and a need for the capital offered by the protocol, indicating its relevance and utility in the market.
In addition, the total borrowed amount influences the interest rates in the protocol through supply and demand mechanics. Higher borrowing demand can lead to higher interest rates, which can attract more lenders to the platform, balancing the supply with the demand.
Finally, the borrowing activity within a DeFi lending protocol can provide broader economic insights, such as the prevailing sentiment among crypto investors, trends in leverage use, and the overall health of the crypto market.
# Spark
Spark is dedicated to enhancing the DAI. Through SparkLend, a decentralized, non-custodial liquidity platform, users have the opportunity to engage as suppliers, borrowers, or liquidators. Suppliers contribute liquidity to the market, earning interest on their crypto assets, whereas borrowers can obtain loans with overcollateralization.
# Health Factor Distribution
**Overview**
A position's health factor tracks how close to liquidation it is. If the health factor is below 1, it can be liquidated therefore resulting in a loss to the borrower. The Health Factor Distribution indicator shows the share of borrowers within a particular range of health factors, excluding recursive loans.
This indicator is useful to analyze the different range of the protocol’s borrowers, if most of the supply has a low health factor, the solvency of the pool/protocol is at risk due to big liquidations.
**How can I use it?**
This indicator presents useful information both for depositors and liquidators. The greater the amount of loans at risk of liquidation the riskier it becomes for depositors to supply money into the protocol. For liquidators it can be beneficial to analyze during times of market volatility in order to try and anticipate where big liquidations could happen.
Moreover, a more evenly distributed range of health factors indicate that the loans within the protocol are more decentralized across borrowers, making it less likely for all of them to be liquidated at once.
A protocol with a high health factor distribution can be more secure for depositors as there is lower likelihood of massive liquidations, which at times may be unprofitable for liquidators due to slippage on DEXs. Therefore, high health factors should make depositors more comfortable with their positions.
# High Risk Loans
**Overview**
This indicator shows the value of loans that are collateralized against volatile assets that are within 5% of their liquidation threshold. This information is useful to help users understand the protocol and specific pools exposure to high risk loans and for liquidators to anticipate future liquidations
**How can I use it?**
Classifying loans within a 5% liquidation ratio (the ratio of the collateral to the loan value) can provide useful information for understanding the risk associated with a loan in a decentralized finance (DeFi) protocol.
A loan within just 5% of liquidation is considered to be highly risky, as there is a higher likelihood that the loan will be liquidated if the value of the collateral decreases or the loan asset increases in price.
By identifying loans with a liquidation ratio below 5%, investors and users can better understand the level of risk associated, which can help make informed decisions on whether to invest or use the protocol. Additionally, this information can be useful for the DeFi protocol itself to properly manage risk, by adjusting liquidation thresholds or their respective liquidation bonus.
Overall, classifying loans based on their liquidation ratio provides valuable information for understanding the risk associated with each loan and helps ensure the stability and security of the DeFi protocol.
# Liquidation History
**Overview**
This indicator shows the record of all liquidations that have taken place in the Spark protocol over time. Liquidation links are the transaction hash, which can be seen in the Etherscan block explorer. Borrowers are those getting liquidated, while liquidators are seizing their collateral assets.
The indicator is broken down into liquidation, borrower, liquidator, market, debt liquidated collateral seized amount and collateral sized. In addition, it can also be sorted by the liquidation, debt liquidated or collateral seized amount columns.
**How can I use it?**
Knowing the detailed liquidation history in a protocol can provide valuable information for having a clear picture of it. A detailed liquidation history can help users and investors understand the overall risk associated with using the protocol. In addition, it also helps ensure transparency in the protocol, as it provides a clear understanding of the performance of the protocol and the risks associated with using it.
Furthermore, it simplifies the searching process for the most recent liquidations of the protocol, which at times can become tedious.
# Liquidators Leaderboard
**Overview**
This indicator shows the ranking of the top liquidators based on their profits and number of liquidations.
If the value of the collateral provided for a loan drops below the maximum allowed threshold, it is subject to being liquidated by a liquidator. Liquidators receive a "liquidation bonus", or a percentage of the collateral provided, to incentivize them to rebalance the protocol and avoid debts that cannot be repaid.
This indicator is useful, because it gives an idea of the most involved liquidators with the protocol, the dependencies on each and their overall performance.
**How can I use it?**
Liquidators play a critical role in mitigating risk for DeFi lending protocols. Knowing the top liquidators is helpful as they are often more experienced and knowledgeable about the protocol and the risk involved. In addition, having a sizeable crowd of liquidators engaged with the protocol shows a healthy sign, in the case of any risk events the more liquidators aware the better.
Furthermore, for up and coming liquidators observing and imitating better liquidators in the protocol, one can learn from their experience and make use of their insights and strategies. Experienced liquidators often have established techniques that contribute to their success. Imitating these habits can help up and coming liquidators to develop better practices and improve their performance.
# Liquidations Volume
**Overview**
The Liquidation Volume in a DeFi protocol refers to the amount of funds that are seized and sold in the event that a borrower is unable to repay their loan. Liquidations occur when a borrower's collateral falls below a certain value, known as the liquidation threshold.
Here’s an explain it like I’m 5 example of how liquidations take place, where a borrower, Alice, borrows $100 DAI against $140 worth of ETH:
* The value of Alice’s ETH drops to its liquidation threshold, which can be calculated based on its collateral factor.
* Since the DAI borrowed by Alice is someone else’s deposit – let’s say Bob’s DAI – into Spark, the protocol needs to make sure Bob gets his $100 back
* In order to repay the loan, a liquidator, Carl, claims part of Alice’s ETH and slightly less DAI into the protocol, making the difference (known as liquidation bonus)
* This way liquidators like Carl make sure depositors like Bob don’t lose their deposits to borrowers such as Alice taking risky loans
If the value of Alice’s ETH drops such that her position is undercollateralized (i.e. she has less ETH supplied than DAI borrowed) before Carl can liquidate it, then depositors like Bob end up losing part of their funds and the protocol ends with “bad debt”.
**How can I use it?**
The Liquidation Volume in a DeFi protocol provides insight into the level of risk in the system, as higher liquidation volumes can indicate that more borrowers are defaulting on their loans and that the protocol is exposed to greater risk.
In addition, it also provides a sense of the value being obtained by liquidators in order to protect the protocol from bad debt exposure.
# Open Liquidations
**Overview**
This indicator shows the number of open positions and the corresponding volume pending to be liquidated. This information is useful to gauge the exposure and bad debt that the protocol could face.
**How can I use it?**
Knowing the number of loans that can currently be liquidated on a DeFi protocol can provide useful information for understanding if there are any liquidity issues and the current stability of the protocol.
The number of loans that can currently be liquidated gives an indication of the liquidity in the ecosystem, as it represents that there isn’t any liquidator available to execute the position and gain their corresponding premium. A high number of loans that can be liquidated indicates a high necessity for liquidators, which help ensure that the protocol remains stable and secure.
# Unique Liquidator Addresses
**Overview**
This indicator shows the number of unique addresses that have interacted with liquidation contracts in a given day or cumulatively over time. It is a healthy sign for a protocol to have a high number of addresses reliably liquidating positions, this assures depositors that several different liquidators are monitoring positions in the protocol.
**How can I use it?**
Counting the number of unique liquidators in a decentralized finance (DeFi) protocol can provide useful information for understanding the level of decentralization and security of the protocol.
The more unique liquidators a DeFi protocol has, the more decentralized it is, as the risk of a single party controlling the liquidation process is reduced. This helps ensure that the protocol is not vulnerable to manipulation or exploitation by a single party.
A high number of unique liquidators can provide liquidity to the DeFi protocol, as there are more participants available to liquidate loans if needed. This helps ensure that the protocol remains stable and secure, even during times of high demand.
Furthermore, by tracking the number of unique liquidators, DeFi protocols can better understand the distribution of risk, and take appropriate measures to ensure the stability and security of the protocol.
# Collateral Seized
**Overview**
This indicator shows the total amount of each collateral asset being seized for liquidation. If a borrower has more than one asset as collateral for their loan, liquidators get to choose which asset they will seize in order to repay their debt and keep the protocol safe.
**How can I use it?**
This indicator can present both users and the protocol powerful information. From the protocol stand point the preferred assets among liquidators can provide valuable information about market trends and demand. In general liquidators tend to pick assets that have high liquidity, and thus have In addition, changes in the amount of collateral being seized can provide insight into the health of the protocol and current market conditions, allowing both users and the protocol to make informed decisions.
# Blocks Elapsed to Complete Liquidations
**Overview**
This indicator shows the number of blocks it takes for a liquidation to take place, showing the USD amount and percentage of the liquidation paid per block.
The faster liquidations are done, the lower the risk of insolvency for the protocol as it avoids getting exposure to borrowers’ collateral assets.
**How can I use it?**
This indicator is useful to analyze the level of asset exposure that the protocol incurs when a liquidation opportunity arises. The more blocks the opportunity is open to liquidations, the greater the chances that collateral assets can go down in price and end up not being enough to repay debts.
Furthermore, by analyzing how long a liquidator takes advantage of the opportunity users can gain insight into their reliability. If liquidations are taking longer than a few blocks to be executed it would suggest that these are not profitable for liquidators for reasons such as low liquidity of the underlying asset.
# Net Liquidity Flows
**Overview**
The Net Liquidity Flows metric shows the inflows, outflows and supply netflows (deposits minus withdrawals) of liquidity into the protocol or a specific pool.
**How can I use it?**
Knowing the liquidity flows that come into a protocol can be useful in making decisions.
This can provide insight into the overall health and stability of the protocol. In the case there is a steady flow of liquidity coming into the protocol, it could signal that the protocol is thriving and has a strong borrowing demand. On the other hand, high repayments relative to borrows could signal weakening demand for debt in the protocol.
Overall, knowing the liquidity flows of a protocol can provide valuable information about the health of the protocol.
# Net Loans Flows
**Overview**
The Net Flows indicator goes over the inflows, outflows and debt netflows (borrows minus repayments) of the borrowing activity in the protocol.
**How can I use it?**
Knowing the inflows, outflows, and netflows of the borrowing activity in a DeFi protocol can provide powerful insight into the borrower's activity. This one can help to assess the liquidity, borrower behavior and market trends. Moreover, by analyzing the inflows and outflows users are able to better understand the liquidity of the DeFi protocol, which is essential to ensuring its stability. In addition, the netflows shown in the indicator give an indication of whether borrowers are taking out loans or repaying them, which helps to gauge their behavior and the health of the protocol.
# Whales Supply History
**Overview**
This indicator tracks large depositors' deposits, their total supply share, withdrawal and addition amounts on the protocol. This information gives powerful insight into the largest depositors and backers of the protocol, it also gives an idea of which addresses have the greatest borrowing capacity.
The indicator has an adjustable time frame selector that lets users analyze different periods in the protocol. The supply share column is not affected by the time frame selector, showing the current supply share at all times.
**How can I use it?**
This indicator presents useful information both for borrowers and the protocol. Borrowers can track lenders' supply share and calculate scenarios of liquidity withdrawals and how that might affect interest rates on their loans. Users can also track the largest depositors in order to analyze their borrowing power against their deposits, this can be useful information when investigating lenders leverage over the protocol’s deposits.
# Whales Credit History
**Overview**
This indicator tracks large depositors' credits, borrowed share, total borrowed, repayments and liquidations history on the protocol. This information helps to have a better understanding of the whales that are currently interacting with the protocol.
For example, if a whale has a track record of being liquidated, it could be likely and probably has a higher chance that it gets liquidated again.
The indicator has an adjustable time frame selector that lets users analyze different periods in the protocol. The supply share column is not affected by the time frame selector, showing the current supply share at all times.
**How can I use it?**
This indicator gives a well rounded picture of the current whale behavior within the protocol. By tracking large depositor behavior, you can gain valuable insight into the activity of the "whales" in the protocol and how they are affecting the ecosystem.
By examining the liquidation history you can assess the risk associated with lending to the protocol. Moreover, by analyzing the recent payments and total debt users can gauge the whale’s previous interactions with the protocol and try to predict their standard behavior.
Furthermore, the current borrow share allows liquidators and lenders to predict scenarios of whales being liquidated.
# Whale Supply Concentration
**Overview**
This indicator shows the historical concentration of supply in the Spark protocol. This is done by separating depositors in the following two categories:
* Whales: addresses with >1% share of deposits
* Investors: addresses with <1% share of deposits
**How can I use it?**
Lending protocols depositors have the risk of having their liquidity trapped on the protocol if all deposits are being lent out at that time.
This information helps users in analyzing the liquidity risk of not being able to withdraw if a whale withdraws their liquidity first.
It’s also important to clarify that most protocols have mechanisms in place to correct these trends with time. In the case utilization rates are driven too high, rates increase act as an incentive for either for more assets being deposited or debt repaid.
# Whale Borrow Concentration
**Overview**
This indicator shows the historical concentration of loans in the Spark protocol. This is done by separating depositors in the following two categories:
* Whales: addresses with >1% share of borrows
* Investors: addresses with <1% share of borrows
**How can I use it?**
Knowing the biggest borrowers of a protocol can help users make more informed decisions as a lender or borrower.
For example, if you are a lender, you may want to carefully evaluate the creditworthiness of the biggest borrowers before deciding whether to lend to them. On the other hand, if you are a borrower, knowing who the biggest borrowers are can help you gauge the level of competition for loan funds and adjust your borrowing strategy accordingly.
Overall, knowing the biggest borrowers from a lending protocol, and their share of all loans, can provide valuable information that can help you make more informed decisions and manage your financial risks more effectively.
# Whale Exit Simulation
**Overview**
This metric assesses the potential consequences on the protocol's available liquidity and borrowing rates if one or more of the largest depositing addresses were to suddenly withdraw their funds. It's crucial for understanding the concentration risk within the protocol and how dependent the protocol's liquidity and stability are on a few large participants (often called "whales").
This indicator looks at:
* **Largest Depositors:** Identifies the biggest contributors to the protocol's liquidity, focusing on the largest addresses by deposit size.
* **Impact Assessment:** Evaluates the potential impact on available liquidity, borrowing rates, and overall stability of the protocol if these large depositors were to exit, either individually or collectively.
**How can I use it?**
By understanding the potential impact of large withdrawals, protocol managers and users can better gauge liquidity risks. If a significant portion of liquidity could be withdrawn by a small number of addresses, the protocol might be at higher risk of liquidity shortages.
This indicator helps in monitoring the financial stability of the protocol. A high dependence on a few large depositors can make the protocol vulnerable to market manipulations or sudden liquidity crises.
The withdrawal of significant funds can drastically alter borrowing rates due to changes in the supply-demand equilibrium. This indicator allows for the prediction to changes in large depositor behavior.
In summary, the "Whale Exit Simulation" indicator is vital for assessing the concentration risk and potential liquidity challenges in a DeFi lending protocol. It provides insights into how the actions of a few large participants can affect the protocol's stability, interest rates, and the overall safety of user deposits, guiding risk management and strategic decision-making within the DeFi space.
# Collateral Distribution Behind Borrows
**Overview**
Assets being provided as collateral by borrowers of the given asset. This is important information to depositors of the asset being borrowed since some collateral assets have higher risks than others.
**How can I use it?**
Knowing which type of collateral users deposit into protocols in order to borrow the asset under examination presents useful information in different ways.
Different types of collateral have different levels of risk associated with them. For example, some cryptocurrencies are more volatile than others, and some assets may have more counterparty risk. By understanding the types of collateral being deposited, it can help users and the protocol assess the overall risk of loans against certain type of collaterals.
Understanding which types of collateral are popular can provide insights into risk associated with users. For example, if a large number of users are depositing a volatile asset instead of a stable asset, it may indicate that there is a higher level of risk tolerance among depositors.
In decentralized finance (DeFi) platforms, the types of collateral that are accepted by the protocol are often determined by the community and governance mechanisms. Understanding which types of collateral are being deposited can help users to understand the decision making process and to participate in governance activities.
# Liquidation Profitability Simulation
**Overview**
This indicator simulates according to predetermined variables, how profitable it is for a liquidator to liquidate positions according to their health factor.
**How can I use it?**
The indicator measures on its y-axis how profitable it is in percentage terms to liquidate positions according to their respective health factors shown in the x-axis.
By simulating the profitability of liquidating positions, this indicator can give investors further insight into the well being of the protocol. This can provide valuable insights into the incentives of liquidators to maintain a depositors safe. A higher percentage profitability gives liquidators a greater interest to maintain positions in their supposed parameters.
By considering the potential profitability of liquidating positions, as a risk vector it can help depositors to assess the risk associated with holding onto a position in the protocol. This indicator can inform investors about when the level of profitability is too low for liquidators to maintain a safe environment and keep the protocol away from bad debt.
A low percentage profitability for liquidators can be caused by several factors, some of which include: external liquidity on the blockchain in order to liquidate assets, protocol parameters, borrow caps on assets between others.
# Available Liquidity
**Overview**
In DeFi lending protocols, users can deposit their cryptocurrency assets into a pool from which other users can borrow. The Available Liquidity refers to the amount of funds in these pools that have been deposited but not yet borrowed. It's an essential metric that provides insight into the protocol's current capacity to facilitate new loans.
**How can I use it?**
This indicator serves as a direct measure of the protocol's liquidity. High available liquidity indicates that there is a significant amount of capital ready to be borrowed, which can attract borrowers looking for funds.
In addition it also helps in analyzing, interest rates for borrowers, as this are algorithmically determined based on the supply and demand of funds. High available liquidity tends to lower borrowing rates, making it cheaper for users to take out loans, which can increase borrowing activity and overall protocol usage.
Finally, It helps in assessing the risk of liquidity crises. If the available liquidity is low relative to the market size, it might indicate potential liquidity issues, especially if a large proportion of users decide to withdraw their deposits simultaneously.
# Total Supply
**Overview**
The Total Supply indicator essentially measures the total market size of a DeFi (Decentralized Finance) lending protocol. It comprises both the deposits made into the protocol by lenders and the funds borrowed by borrowers. This metric focuses on the total volume of funds actively engaged in the lending and borrowing process, providing a dynamic view of the protocol's activity.
The indicator encapsulates the entire ecosystem of a lending protocol, including:
* **Deposits:** The total amount of funds that lenders have supplied to the protocol.
* **Borrows:** The total amount of funds that borrowers have currently taken out as loans from the protocol.
The sum of these two components gives us the aggregate market size of the lending protocol, offering a comprehensive snapshot of its financial activity.
**How can I use it?**
This indicator allows users, investors, and analysts to gauge the overall size of the lending protocol's market. A larger aggregate amount suggests a more extensive ecosystem. Moreover, changes in the aggregate amount of funds supplied can be a clear indicator of the protocol's growth or contraction over time. An increasing trend may signal rising trust and participation in the protocol, while a decrease could indicate the opposite.
By comparing this metric across different DeFi lending protocols, stakeholders can evaluate the relative market position and competitiveness of a protocol. This can inform investment decisions, protocol improvements, and strategic planning.
In essence, the aggregate amount of funds supplied for lending is a critical indicator for understanding the scale and dynamics of a DeFi lending protocol. It provides valuable insights into the protocol's market size, growth trends, risk profile, and the liquidity environment, serving as a crucial tool for decision-making and analysis within the DeFi space.
# Total Debt
**Overview**
The Total Debt is a dynamic indicator that fluctuates with borrower activity, including new loans being taken out and existing loans being repaid. It includes:
* **Current Outstanding Loans:** The total value of all active loans that have yet to be repaid.
* **Historical Borrowing Activity:** While primarily concerned with current outstanding amounts, trends in this indicator can also reflect historical borrowing activity and demand patterns over time.
**How can I use it?**
This indicator directly measures the demand for borrowing within the protocol. A high total borrowed amount suggests strong user engagement and a need for the capital offered by the protocol, indicating its relevance and utility in the market.
In addition, the total borrowed amount influences the interest rates in the protocol through supply and demand mechanics. Higher borrowing demand can lead to higher interest rates, which can attract more lenders to the platform, balancing the supply with the demand.
Finally, the borrowing activity within a DeFi lending protocol can provide broader economic insights, such as the prevailing sentiment among crypto investors, trends in leverage use, and the overall health of the crypto market.
# Curve
Curve Finance is a decentralized finance (DeFi) protocol designed to optimize the trading of stablecoins and other similar assets on the blockchain. It specializes in providing low-slippage and efficient swaps between assets with similar values, such as different types of stablecoins. Curve achieves this by utilizing advanced mathematical algorithms. Curve Finance plays a pivotal role in the DeFi ecosystem by offering users a reliable and cost-effective means to trade stable assets while maintaining price stability.
# Net Liquidity Flows
**Overview**
The Net Liquidity Flows metric shows the inflows, outflows and supply netflows (deposits minus withdrawals) of liquidity into the protocol or a specific pool.
**How can I use it?**
Knowing the liquidity flows that come into a protocol or pool can be useful in making decisions.
This can provide insight into the overall health and stability of the protocol. In the case there is a steady flow of liquidity coming into the protocol, it could signal that the protocol is thriving and has a strong demand. On the other hand, high withdrawals relative to deposits could signal weakening demand for the protocol.
Overall, knowing the liquidity flows of a protocol can provide valuable information about the health of the specific pools and of the protocol.
# Unique Arbitrageur Addresses
**Overview**
This indicator tracks the number of unique addresses involved in arbitrage activity in a specific pool or the general protocol. Arbitrage, in this context, refers to the simultaneous buying and selling of an asset in different markets in order to take advantage of differing prices for the same asset.
**How can I use it?**
The number of unique addresses engaging in arbitrage activities is tracked on a daily basis. Each unique address that performs arbitrage is counted once per day, even if multiple transactions are performed. The number of arbitrages can also be seen in the indicator. For the cumulative view, all unique addresses engaging in arbitrage since the beginning of tracking are summed up.
This indicator helps understand the level of arbitrage activity in the pool. Higher numbers suggest more active arbitrage, indicating that there might be significant price disparities that traders are taking advantage of. This could be a sign of market inefficiencies, volatility, or potential risk for the pool's liquidity.
# Protocol Concentration
**Overview**
This indicator tracks the historical concentration of other major protocols like: Convex, Yearn and Conic depositing into Curve pools. In addition, it also tracks large individual investors, referred to as 'unknown,' depositing into protocol.
**How can I use it?**
The indicator quantifies deposit transactions from addresses that belong to Convex, Yearn and other protocols, as well as whale deposits into the Curve protocol. These deposit transactions are then expressed as a percentage of the total deposit transactions in the protocol.
The indicator provides insights into the adoption and usage of the Curve protocol by other DeFi protocols and large investors. High concentration levels could indicate strong partnerships or synergies between the protocols, while a high concentration of 'whales' could suggest the platform is trusted by large scale investors.
# Peg Monitor
**Overview**
This indicator measures the difference in price between one asset and other assets within a specific liquidity pool. The divergence could be either positive or negative, depending on whether the asset's price is higher or lower than other assets in the pool.
**How can I use it?**
The indicator determines the price of a specific asset in the pool and compares it to the price of other assets in the same pool. The divergence is the difference between these prices.
This indicator is useful in several ways for one, identifying potential arbitrage opportunities. If the price of an asset in one pool is significantly different from its price in another pool, traders may buy the asset in the pool where it is cheaper and sell it in the pool where it is more expensive to earn profits.
Furthermore, this indicator also helps users track risks that come when dealing with assets that follow specific price pegs. Some of this risks are:
The most immediate risk is a loss of value. If an asset is supposed to be pegged to a certain value, and it departs from that value, it means holders of that asset are either losing or gaining money unexpectedly.
Lastly, In cases where the asset being depegged is used as collateral for loans or other DeFi protocols, a sudden depeg could result in under-collateralization, which could lead to forced liquidations and increased volatility in the market.
# Time Elapsed For Peg To Be Restored
**Overview**
This indicator measures the amount of time it takes for an asset that has deviated by at least 0.5% from its intended price (or peg) to return to its pegged value. It also shows the USD amount and percentage of the recovery.
**How can I use it?**
The indicator records each time a deviation occurs, the calculation starts when an asset's price deviates by 0.5% or more from its intended peg. The time taken for the price to return to its pegged value is tracked, along with the USD amount and percentage of the recovery. The percentage of recovery can be calculated as the ratio of the price difference after the recovery to the price difference at the maximum deviation point.
This indicator is valuable for understanding the stability of an asset and the efficiency of mechanisms in place to maintain its peg. Rapid re-pegging and full recovery indicate strong stability and effective market mechanisms. Conversely, slow re-pegging and partial recovery may signal potential issues with the asset's stability or the market's confidence in it.
# Market Depth
**Overview**
This indicator measures the amount of volume the market can process on both the buy-side and sell-side at a specified price impact percentage. Price impact is the difference between the expected price of a trade and the price at which the trade is executed.
**How can I use it?**
This indicator helps understand the depth and liquidity of the market. A higher volume at a given price impact percentage indicates more liquidity, suggesting that large trades can be executed without significantly affecting the asset's price. This is useful for traders and investors planning to execute large trades, as well as for assessing the overall health and liquidity of the market.
# Exit Fee Evolution
**Overview**
This indicator uses simulations to project the potential price impact for Curve pool depositors if a whale addresses (large depositors) were to withdraw their liquidity. By modeling the possible outcomes of significant liquidity withdrawals by the largest depositors, it provides insights into the potential market impacts, risks, and price impact conditions.
The indicator leverages historical data, current market conditions, and specific modeling techniques to simulate scenarios where large depositors withdraw their liquidity. Various factors, such as the size of the withdrawal, current liquidity pool composition, trading volumes, and market dynamics, are considered in the simulations.
**How can I use it?**
Understanding the potential price impact if large depositors withdraw can help traders, investors, and liquidity providers gauge the risks and market stability associated with LPing. By projecting these scenarios, market participants can make informed decisions, set proper risk management strategies, and anticipate possible market movements.
In decentralized finance, price impact refers to the difference between the expected price of a trade and the actual price at which it's executed. Significant withdrawals from large holders (whales) can cause substantial price shifts and price impact, affecting other traders and market dynamics. This indicator, focusing on exit fees, helps in understanding and preparing for potential large-scale withdrawal scenarios, thereby aiding in risk management and strategic planning.
# De-Peg Leaderboard
**Overview**
This indicator consists of a comprehensive table displaying historical de-pegging events for a given asset. These events are characterized by instances where the price deviates by +/- 0.5% or more from the intended peg. The table includes details such as the duration of the de-pegging event (in hours), the Total Value Locked (TVL) in the pool at that time, losses accrued by Liquidity Providers (LPs), among other relevant metrics.
**How can I use it?**
This indicator offers valuable insights into the stability and robustness of a pegged asset. Understanding previous de-pegging events and their magnitude allows market participants to assess the risks, resilience, and potential implications of future deviations. It's instrumental in decision-making for liquidity providers, traders, and risk managers.
De-pegging events can be critical in the world of stablecoins and other pegged assets, where maintaining a specific price is essential. A comprehensive understanding of these events aids in evaluating the stability mechanisms, liquidity, and overall health of the asset and associated pools.
Monitoring this indicator is vital for those actively involved in pegged assets, as it aids in recognizing patterns, identifying vulnerabilities, and planning strategies to mitigate potential risks associated with de-pegging.
The indicator relies on historical data and does not predict future de-pegging events. It requires careful interpretation, considering various factors that may have contributed to each de-pegging instance.
# Arbitrages Leaderboard
**Overview**
This indicator is a comprehensive table constructed to identify and analyze active arbitrage participants within the Curve protocol. It includes valuable details such as the addresses of the arbitrageurs, the number of arbitrages they have engaged in, and the timestamps of their first and last arbitrage activities. By sorting these columns, users can discover additional insights and valuable data points that provide an understanding of the ongoing interactions with the protocol, and who is actively engaged in arbitrage activities.
**How can I use it?**
This indicator provides a clear view of the active arbitrage landscape within the protocol. It helps in spotting addresses that are actively engaged and can be useful for protocol developers, market analysts, and traders to understand the dynamics, potential inefficiencies, and profit opportunities in the market. It may also be used to identify patterns and trends that can inform trading strategies or risk management decisions.
Arbitrage is a common practice in financial markets and is particularly relevant in decentralized finance (DeFi) where price discrepancies may occur across different exchanges. Understanding the actors involved in these activities can provide insights into market efficiency, liquidity, and potential investment opportunities.
This indicator is a powerful tool for those looking to delve into the intricacies of arbitrage. By understanding the actors involved and their behaviors, it may reveal underlying market dynamics, efficiencies or inefficiencies, and areas for potential profit or innovation within the protocol. It also assists in monitoring the engagement levels and activities of participants within the ecosystem, offering a broader perspective on the health and activity of the market.
# crvUSD
Curve's protocol crvUSD is a stablecoin designed to maintain a stable value, closely pegged to the US Dollar, within the Curve Finance ecosystem, a decentralized finance (DeFi) platform known for its efficient stablecoin trading. CRVUSD leverages advanced algorithms and smart contracts to ensure price stability and minimize volatility, targeting to be a reliable medium of exchange and store of value in the cryptocurrency market.
---
[Next Page](https://resources.defirisk.intotheblock.com/llms-full.txt/1)